Estimated Value: $172,000 - $350,000
3
Beds
2
Baths
1,296
Sq Ft
$178/Sq Ft
Est. Value
About This Home
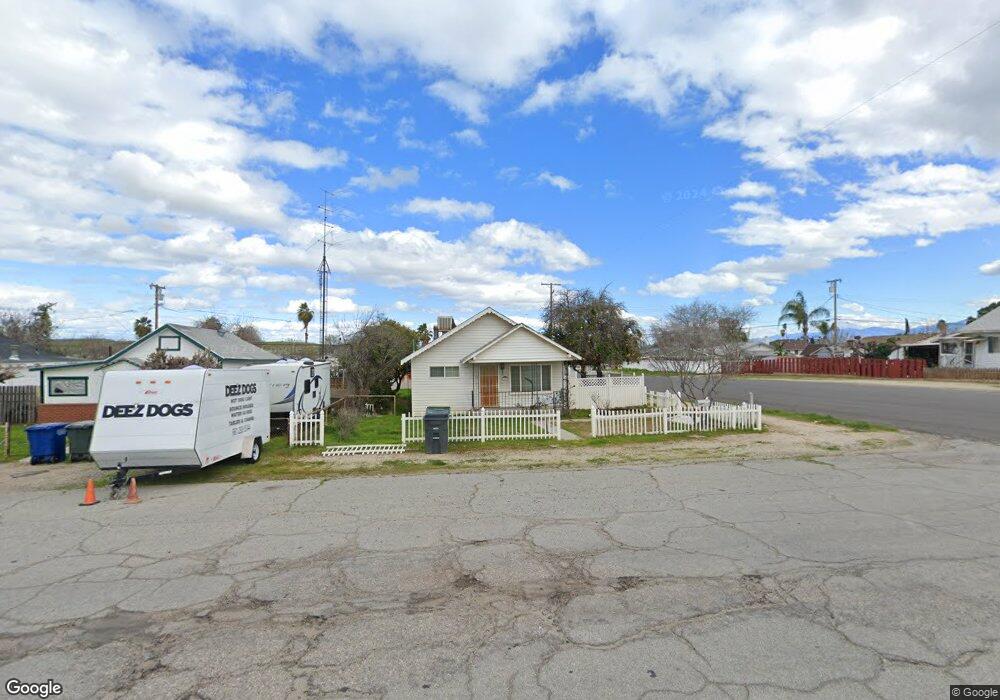
This home is located at 400 Pierce St, Taft, CA 93268 and is currently estimated at $230,376, approximately $177 per square foot. 400 Pierce St is a home located in Kern County with nearby schools including Jefferson Elementary School, Roosevelt Elementary School, and Lincoln Junior High School.
Ownership History
Date
Name
Owned For
Owner Type
Purchase Details
Closed on
Feb 15, 2024
Sold by
Mcelmurry Keith D
Bought by
Gill Tyler
Current Estimated Value
Home Financials for this Owner
Home Financials are based on the most recent Mortgage that was taken out on this home.
Original Mortgage
$90,000
Outstanding Balance
$88,424
Interest Rate
6.66%
Mortgage Type
New Conventional
Estimated Equity
$141,952
Purchase Details
Closed on
Nov 3, 2004
Sold by
Mcelmurry Wilma D
Bought by
Mcelmurry Keith D and Mcelmurry Sharon R
Create a Home Valuation Report for This Property
The Home Valuation Report is an in-depth analysis detailing your home's value as well as a comparison with similar homes in the area
Home Values in the Area
Average Home Value in this Area
Purchase History
| Date | Buyer | Sale Price | Title Company |
|---|---|---|---|
| Gill Tyler | $125,000 | Wfg National Title | |
| Gill Tyler | -- | Wfg National Title | |
| Mcelmurry Keith D | -- | Wfg National Title | |
| Mcelmurry Keith D | -- | -- |
Source: Public Records
Mortgage History
| Date | Status | Borrower | Loan Amount |
|---|---|---|---|
| Open | Gill Tyler | $90,000 |
Source: Public Records
Tax History
| Year | Tax Paid | Tax Assessment Tax Assessment Total Assessment is a certain percentage of the fair market value that is determined by local assessors to be the total taxable value of land and additions on the property. | Land | Improvement |
|---|---|---|---|---|
| 2025 | $2,025 | $127,500 | $38,250 | $89,250 |
| 2024 | $2,025 | $28,834 | $6,117 | $22,717 |
| 2023 | $1,805 | $28,270 | $5,998 | $22,272 |
| 2022 | $1,601 | $27,717 | $5,881 | $21,836 |
| 2021 | $1,459 | $27,174 | $5,766 | $21,408 |
| 2020 | $1,338 | $26,896 | $5,707 | $21,189 |
| 2019 | $1,315 | $26,896 | $5,707 | $21,189 |
| 2018 | $1,280 | $25,854 | $5,487 | $20,367 |
| 2017 | $1,270 | $25,348 | $5,380 | $19,968 |
| 2016 | $1,222 | $24,852 | $5,275 | $19,577 |
| 2015 | $1,140 | $24,479 | $5,196 | $19,283 |
| 2014 | $1,060 | $24,001 | $5,095 | $18,906 |
Source: Public Records
Map
Nearby Homes
Your Personal Tour Guide
Ask me questions while you tour the home.