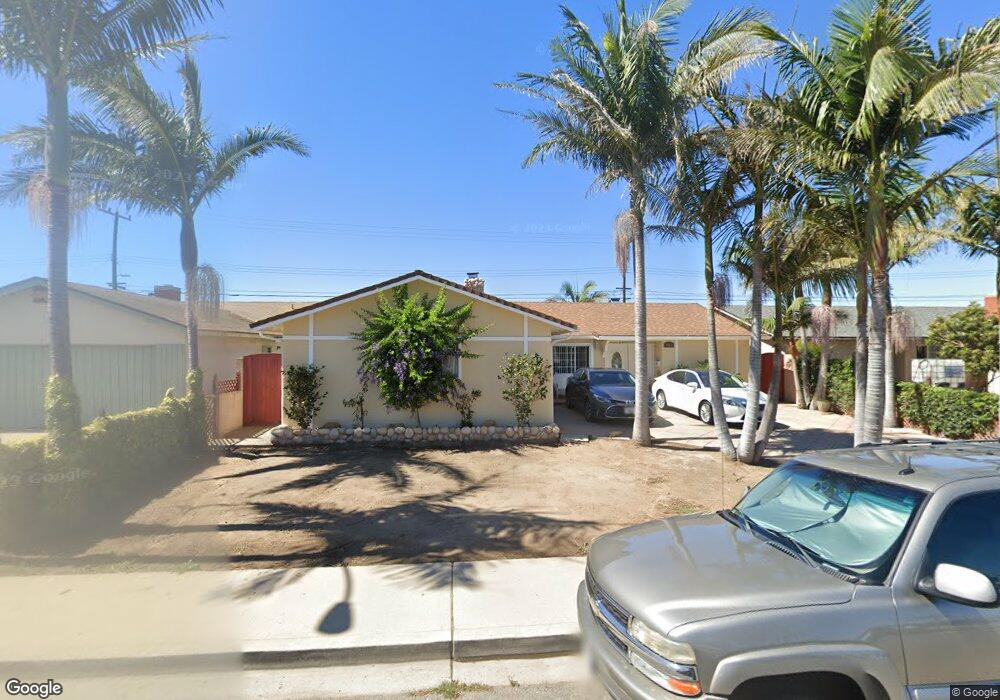
4011 San Juan Ave Oxnard, CA 93033
Blackstock South NeighborhoodEstimated Value: $672,000 - $794,000
3
Beds
2
Baths
1,752
Sq Ft
$417/Sq Ft
Est. Value
About This Home
This home is located at 4011 San Juan Ave, Oxnard, CA 93033 and is currently estimated at $731,333, approximately $417 per square foot. 4011 San Juan Ave is a home located in Ventura County with nearby schools including Fred L. Williams Elementary School and Channel Islands High School.
Ownership History
Date
Name
Owned For
Owner Type
Purchase Details
Closed on
May 27, 2021
Sold by
Martinez Henry and Martinez Luz
Bought by
The Martinez Family Trust
Current Estimated Value
Purchase Details
Closed on
Apr 24, 2020
Sold by
Martinez Veronica E
Bought by
Martinez Henry and Martinez Luz
Home Financials for this Owner
Home Financials are based on the most recent Mortgage that was taken out on this home.
Original Mortgage
$415,140
Interest Rate
3.6%
Mortgage Type
FHA
Purchase Details
Closed on
May 5, 2005
Sold by
Martinez Henry and Martinez Luz M
Bought by
Martinez Henry and Martinez Luz M
Home Financials for this Owner
Home Financials are based on the most recent Mortgage that was taken out on this home.
Original Mortgage
$254,000
Interest Rate
6.02%
Mortgage Type
Fannie Mae Freddie Mac
Create a Home Valuation Report for This Property
The Home Valuation Report is an in-depth analysis detailing your home's value as well as a comparison with similar homes in the area
Home Values in the Area
Average Home Value in this Area
Purchase History
| Date | Buyer | Sale Price | Title Company |
|---|---|---|---|
| The Martinez Family Trust | -- | None Available | |
| Martinez Henry | -- | Chicago Title Company | |
| Martinez Henry | -- | -- |
Source: Public Records
Mortgage History
| Date | Status | Borrower | Loan Amount |
|---|---|---|---|
| Closed | Martinez Henry | $415,140 | |
| Closed | Martinez Henry | $254,000 |
Source: Public Records
Tax History Compared to Growth
Tax History
| Year | Tax Paid | Tax Assessment Tax Assessment Total Assessment is a certain percentage of the fair market value that is determined by local assessors to be the total taxable value of land and additions on the property. | Land | Improvement |
|---|---|---|---|---|
| 2025 | $4,786 | $406,962 | $137,017 | $269,945 |
| 2024 | $4,786 | $398,983 | $134,331 | $264,652 |
| 2023 | $4,503 | $391,160 | $131,697 | $259,463 |
| 2022 | $3,706 | $322,791 | $129,115 | $193,676 |
| 2021 | $3,750 | $316,462 | $126,583 | $189,879 |
| 2020 | $3,818 | $313,219 | $125,286 | $187,933 |
| 2019 | $3,702 | $307,079 | $122,830 | $184,249 |
| 2018 | $3,565 | $301,059 | $120,422 | $180,637 |
| 2017 | $3,448 | $295,157 | $118,061 | $177,096 |
| 2016 | $3,283 | $289,371 | $115,747 | $173,624 |
| 2015 | $3,332 | $285,026 | $114,009 | $171,017 |
| 2014 | $3,270 | $279,445 | $111,777 | $167,668 |
Source: Public Records
Map
Nearby Homes
- 840 Morro Way
- 521 Del Sur Way
- 4331 Hamilton Ave
- 413 Percy St
- 234 Johnson Rd
- 180 Gaviota Place Unit 155
- 140 Borrego Ave Unit 174
- 4700 Hamilton Ave
- 3151 Fournier St
- 1630 Nelson Place
- 4578 Saviers Rd
- 1004 Cheyenne Way
- 4941 Terrace Ave
- 225 Glacier Ave
- 3039 Fournier St
- 0 Saviers Rd
- 5110 Longfellow Way
- 153 Frank Ave
- 4210 Drake Dr
- 168 Lark St
- 4001 San Juan Ave
- 4021 San Juan Ave
- 4031 San Juan Ave
- 3931 San Juan Ave
- 740 Avalon Way
- 4041 San Juan Ave
- 750 Avalon Way
- 4034 San Juan Ave
- 741 Avalon Way
- 4044 San Juan Ave
- 4101 San Juan Ave
- 731 Donner St
- 754 Avalon Way
- 751 Avalon Way
- 745 Columbia Dr
- 740 Borrego Way
- 4111 San Juan Ave
- 753 Columbia Dr
- 3901 San Juan Ave
- 761 Avalon Way