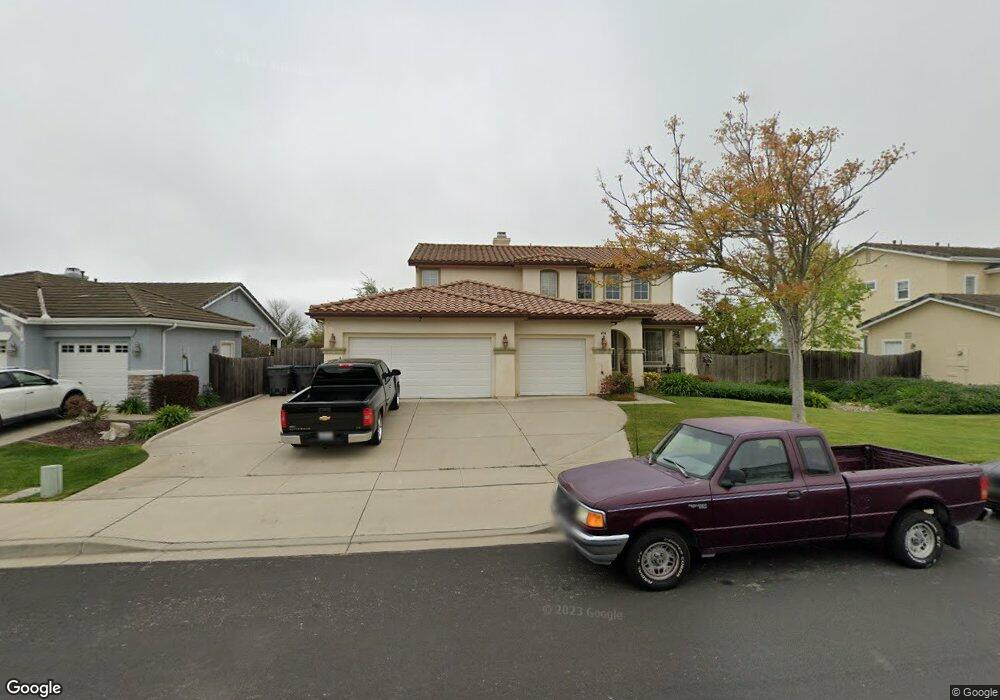
404 Nogal Lompoc, CA 93436
Mission Hills NeighborhoodEstimated Value: $795,590 - $958,000
4
Beds
4
Baths
2,384
Sq Ft
$360/Sq Ft
Est. Value
About This Home
This home is located at 404 Nogal, Lompoc, CA 93436 and is currently estimated at $857,898, approximately $359 per square foot. 404 Nogal is a home located in Santa Barbara County with nearby schools including Los Berros Visual and Performing Arts Academy, Cabrillo High School, and Olive Grove Charter - Lompoc.
Ownership History
Date
Name
Owned For
Owner Type
Purchase Details
Closed on
Nov 11, 2013
Sold by
Allen William E and Allen Colene M
Bought by
Marquez Raul and Marquez Irma
Current Estimated Value
Home Financials for this Owner
Home Financials are based on the most recent Mortgage that was taken out on this home.
Original Mortgage
$332,000
Outstanding Balance
$247,589
Interest Rate
4.23%
Mortgage Type
New Conventional
Estimated Equity
$610,309
Purchase Details
Closed on
Jul 28, 2003
Sold by
B & K Lompoc Homes Llc
Bought by
Allen William E and Allen Colene M
Home Financials for this Owner
Home Financials are based on the most recent Mortgage that was taken out on this home.
Original Mortgage
$371,700
Interest Rate
5.87%
Mortgage Type
Purchase Money Mortgage
Create a Home Valuation Report for This Property
The Home Valuation Report is an in-depth analysis detailing your home's value as well as a comparison with similar homes in the area
Home Values in the Area
Average Home Value in this Area
Purchase History
| Date | Buyer | Sale Price | Title Company |
|---|---|---|---|
| Marquez Raul | $415,000 | Fidelity National Title Co | |
| Allen William E | $465,000 | First American Title |
Source: Public Records
Mortgage History
| Date | Status | Borrower | Loan Amount |
|---|---|---|---|
| Open | Marquez Raul | $332,000 | |
| Previous Owner | Allen William E | $371,700 |
Source: Public Records
Tax History
| Year | Tax Paid | Tax Assessment Tax Assessment Total Assessment is a certain percentage of the fair market value that is determined by local assessors to be the total taxable value of land and additions on the property. | Land | Improvement |
|---|---|---|---|---|
| 2025 | $5,446 | $508,721 | $122,581 | $386,140 |
| 2023 | $5,446 | $488,969 | $117,822 | $371,147 |
| 2022 | $5,351 | $479,382 | $115,512 | $363,870 |
| 2021 | $5,411 | $469,984 | $113,248 | $356,736 |
| 2020 | $5,352 | $465,166 | $112,087 | $353,079 |
| 2019 | $5,263 | $456,046 | $109,890 | $346,156 |
| 2018 | $5,181 | $447,105 | $107,736 | $339,369 |
| 2017 | $5,086 | $438,339 | $105,624 | $332,715 |
| 2016 | $4,993 | $429,745 | $103,553 | $326,192 |
| 2014 | $4,884 | $415,000 | $100,000 | $315,000 |
Source: Public Records
Map
Nearby Homes
- 2655 Adobe Falls Rd
- 778 Tamarisk Dr
- 757 Onstott Rd
- 832 Onstott Rd
- 892 Onstott Rd
- 972 Pellham Dr
- 100 California 1
- 1407 N H St
- 549 Palomar Cir
- 3725 Jupiter Ave
- 731 Voyager Rd
- 1121 Bell Ave
- 933 Bellflower Ln
- 1588 Calle Portos
- 728 Pluto Ave
- 1127 Bell Ave
- 3843 Cassini Cir Unit 3
- 1344 Village Meadows Dr
- 1100 N Third St
- 3825 Saturn Ave Unit 1
Your Personal Tour Guide
Ask me questions while you tour the home.