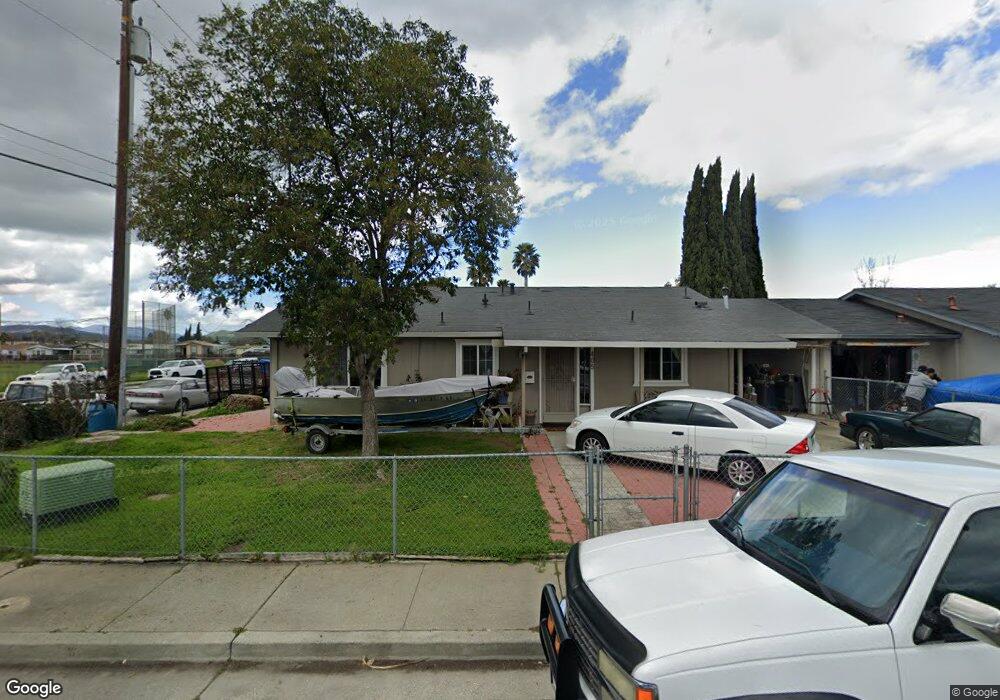
405 Grant Ct Gilroy, CA 95020
Estimated Value: $707,624 - $793,000
3
Beds
2
Baths
1,190
Sq Ft
$635/Sq Ft
Est. Value
About This Home
This home is located at 405 Grant Ct, Gilroy, CA 95020 and is currently estimated at $756,156, approximately $635 per square foot. 405 Grant Ct is a home located in Santa Clara County with nearby schools including Rucker Elementary School, South Valley Middle School, and Solorsano Middle School.
Ownership History
Date
Name
Owned For
Owner Type
Purchase Details
Closed on
Oct 30, 2015
Sold by
Gracia Plaza Ruben C and Gracia Plaza
Bought by
Plaza Paul
Current Estimated Value
Purchase Details
Closed on
Nov 21, 2006
Sold by
Gracia Plaza Ruben C and Gracia Plaza
Bought by
Gracia Plaza Ruben C and Gracia Plaza
Create a Home Valuation Report for This Property
The Home Valuation Report is an in-depth analysis detailing your home's value as well as a comparison with similar homes in the area
Home Values in the Area
Average Home Value in this Area
Purchase History
| Date | Buyer | Sale Price | Title Company |
|---|---|---|---|
| Plaza Paul | -- | None Available | |
| Gracia Plaza Ruben C | $162,000 | None Available |
Source: Public Records
Tax History
| Year | Tax Paid | Tax Assessment Tax Assessment Total Assessment is a certain percentage of the fair market value that is determined by local assessors to be the total taxable value of land and additions on the property. | Land | Improvement |
|---|---|---|---|---|
| 2025 | $2,664 | $217,644 | $93,808 | $123,836 |
| 2024 | $2,664 | $213,377 | $91,969 | $121,408 |
| 2023 | $2,646 | $209,194 | $90,166 | $119,028 |
| 2022 | $2,599 | $205,094 | $88,399 | $116,695 |
| 2021 | $2,584 | $201,073 | $86,666 | $114,407 |
| 2020 | $2,555 | $199,012 | $85,778 | $113,234 |
| 2019 | $2,530 | $195,111 | $84,097 | $111,014 |
| 2018 | $2,365 | $191,287 | $82,449 | $108,838 |
| 2017 | $2,410 | $187,537 | $80,833 | $106,704 |
| 2016 | $2,352 | $183,861 | $79,249 | $104,612 |
| 2015 | $2,306 | $181,100 | $78,059 | $103,041 |
| 2014 | $2,291 | $177,553 | $76,530 | $101,023 |
Source: Public Records
Map
Nearby Homes
- 8282 Murray Ave Unit 99
- 8282 Murray Ave Unit 65
- 160 Sarafina Way
- 0 Magic Springs Dr Unit ML82028522
- 0 Dorrance Rd Unit ML82002071
- 0000 Hecker Pass
- 7621 Forest St
- 332 Lewis St Unit 1/2
- 332 Lewis St
- 7711 Monterey St
- 7691 Church St Unit B
- 194 4th St
- 0 Monterey Rd
- 262 E 6th St
- 7630 Hanna St
- 7681 Hanna St
- 401 Arnold Dr
- 622 Broadway
- 620 Broadway
- 626 Broadway
Your Personal Tour Guide
Ask me questions while you tour the home.