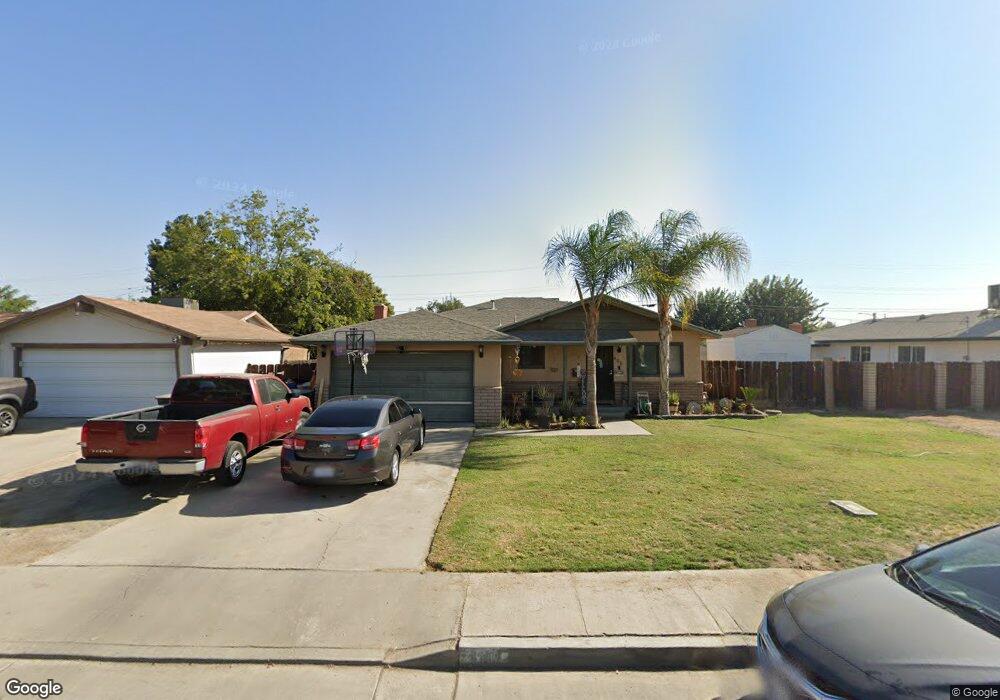
406 W Spring Ln Lemoore, CA 93245
Estimated Value: $309,000 - $366,000
3
Beds
2
Baths
2,016
Sq Ft
$171/Sq Ft
Est. Value
About This Home
This home is located at 406 W Spring Ln, Lemoore, CA 93245 and is currently estimated at $344,874, approximately $171 per square foot. 406 W Spring Ln is a home located in Kings County with nearby schools including Meadow Lane Elementary School, Liberty Middle School, and Lemoore High School.
Ownership History
Date
Name
Owned For
Owner Type
Purchase Details
Closed on
Jan 12, 2007
Sold by
Rodriguez Elpidio G and Gonzales Emma
Bought by
Gonzales Emma
Current Estimated Value
Home Financials for this Owner
Home Financials are based on the most recent Mortgage that was taken out on this home.
Original Mortgage
$120,000
Outstanding Balance
$71,272
Interest Rate
6.1%
Mortgage Type
New Conventional
Estimated Equity
$273,602
Purchase Details
Closed on
Jun 25, 1999
Sold by
Federal National Mortgage Association
Bought by
Rodriguez Elpidio G and Gonzales Emma
Home Financials for this Owner
Home Financials are based on the most recent Mortgage that was taken out on this home.
Original Mortgage
$81,474
Interest Rate
7.64%
Mortgage Type
FHA
Purchase Details
Closed on
Apr 13, 1999
Sold by
Principal Residential Mtg Inc
Bought by
Federal National Mortgage Association
Purchase Details
Closed on
Apr 6, 1999
Sold by
Chapman John R and Chapman Marcell J
Bought by
Principal Wholesale Mtg Inc and Reliastar Mtg Corp
Create a Home Valuation Report for This Property
The Home Valuation Report is an in-depth analysis detailing your home's value as well as a comparison with similar homes in the area
Home Values in the Area
Average Home Value in this Area
Purchase History
| Date | Buyer | Sale Price | Title Company |
|---|---|---|---|
| Gonzales Emma | -- | Placer Title Company | |
| Rodriguez Elpidio G | $82,000 | Chicago Title Co | |
| Federal National Mortgage Association | -- | First American Title Ins Co | |
| Principal Wholesale Mtg Inc | $75,225 | First American Title Ins Co |
Source: Public Records
Mortgage History
| Date | Status | Borrower | Loan Amount |
|---|---|---|---|
| Open | Gonzales Emma | $120,000 | |
| Closed | Rodriguez Elpidio G | $81,474 |
Source: Public Records
Tax History
| Year | Tax Paid | Tax Assessment Tax Assessment Total Assessment is a certain percentage of the fair market value that is determined by local assessors to be the total taxable value of land and additions on the property. | Land | Improvement |
|---|---|---|---|---|
| 2025 | $1,983 | $237,311 | $59,404 | $177,907 |
| 2023 | $1,983 | $194,765 | $57,099 | $137,666 |
| 2022 | $2,078 | $190,947 | $55,980 | $134,967 |
| 2021 | $2,024 | $187,204 | $54,883 | $132,321 |
| 2020 | $2,013 | $185,284 | $54,320 | $130,964 |
| 2019 | $1,995 | $181,651 | $53,255 | $128,396 |
| 2018 | $1,873 | $178,089 | $52,211 | $125,878 |
| 2017 | $1,876 | $174,597 | $51,187 | $123,410 |
| 2016 | $1,763 | $171,173 | $50,183 | $120,990 |
| 2015 | $1,755 | $168,602 | $49,429 | $119,173 |
| 2014 | $1,702 | $165,300 | $48,461 | $116,839 |
Source: Public Records
Map
Nearby Homes
- 636 Castellina St
- 1150 Fire Fall Ave
- 315 W Glendale Ave
- 701 Strada St
- 756 Strada St
- 137 W Spruce Ave
- 1504 Quartz Ave
- 0 18 3 4 Ave
- 1542 Quartz Ave
- 1535 Quartz Ave
- 1513 Quartz Ave
- 1523 Quartz Ave
- 1542 N Lemoore Ave
- 865 Avalon Dr
- 164 Cantebury Dr
- 1475 Quandt Dr
- 337 E Deodar Ln
- 809 Wildwood Dr
- 698 Wexford Ct
- 1005 Jubilee Ct
- 414 W Spring Ln
- 378 Juniper Ln
- 419 W Burlwood Ln
- 366 Juniper Ln
- 423 W Burlwood Ln
- 409 W Spring Ln
- 417 W Spring Ln
- 424 Juniper Ln
- 430 W Spring Ln
- 381 Juniper Ln
- 425 W Spring Ln
- 435 W Burlwood Ln
- 367 Juniper Ln
- 433 W Spring Ln
- 438 W Spring Ln
- 427 Juniper Ln
- 342 Juniper Ln
- 398 W Spring Ln
- 416 W Burlwood Ln
- 439 W Burlwood Ln
Your Personal Tour Guide
Ask me questions while you tour the home.