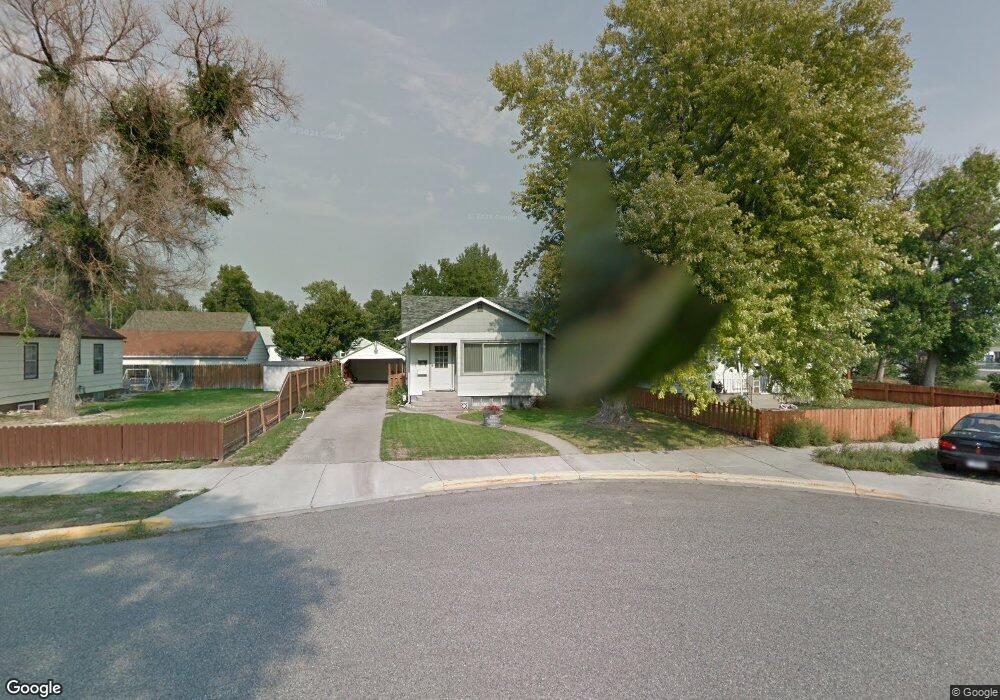
409 S 39th St Billings, MT 59101
South Side NeighborhoodEstimated Value: $151,000 - $294,491
2
Beds
2
Baths
1,792
Sq Ft
$133/Sq Ft
Est. Value
About This Home
This home is located at 409 S 39th St, Billings, MT 59101 and is currently estimated at $238,123, approximately $132 per square foot. 409 S 39th St is a home located in Yellowstone County with nearby schools including Orchard School, Riverside Junior High School, and Billings Senior High School.
Ownership History
Date
Name
Owned For
Owner Type
Purchase Details
Closed on
Jan 24, 2019
Sold by
Forney Lisa L
Bought by
Pressley Phillip and Mosbacher Callie L
Current Estimated Value
Home Financials for this Owner
Home Financials are based on the most recent Mortgage that was taken out on this home.
Original Mortgage
$153,174
Outstanding Balance
$137,961
Interest Rate
5.89%
Mortgage Type
FHA
Estimated Equity
$100,162
Purchase Details
Closed on
Dec 16, 2011
Sold by
Roh Marion L
Bought by
Forney Lisa L
Home Financials for this Owner
Home Financials are based on the most recent Mortgage that was taken out on this home.
Original Mortgage
$112,084
Interest Rate
3.75%
Mortgage Type
FHA
Create a Home Valuation Report for This Property
The Home Valuation Report is an in-depth analysis detailing your home's value as well as a comparison with similar homes in the area
Home Values in the Area
Average Home Value in this Area
Purchase History
| Date | Buyer | Sale Price | Title Company |
|---|---|---|---|
| Pressley Phillip | -- | Chicago Title | |
| Forney Lisa L | -- | Chicago Title |
Source: Public Records
Mortgage History
| Date | Status | Borrower | Loan Amount |
|---|---|---|---|
| Open | Pressley Phillip | $153,174 | |
| Previous Owner | Forney Lisa L | $112,084 |
Source: Public Records
Tax History Compared to Growth
Tax History
| Year | Tax Paid | Tax Assessment Tax Assessment Total Assessment is a certain percentage of the fair market value that is determined by local assessors to be the total taxable value of land and additions on the property. | Land | Improvement |
|---|---|---|---|---|
| 2025 | $2,119 | $233,500 | $39,332 | $194,168 |
| 2024 | $2,119 | $201,000 | $38,678 | $162,322 |
| 2023 | $2,126 | $201,000 | $38,678 | $162,322 |
| 2022 | $1,965 | $162,900 | $31,825 | $131,075 |
| 2021 | $1,877 | $162,900 | $0 | $0 |
| 2020 | $1,988 | $162,200 | $0 | $0 |
| 2019 | $1,891 | $162,200 | $0 | $0 |
| 2018 | $1,880 | $158,800 | $0 | $0 |
| 2017 | $1,470 | $158,800 | $0 | $0 |
| 2016 | $1,724 | $150,360 | $0 | $0 |
| 2015 | $1,680 | $150,360 | $0 | $0 |
| 2014 | $1,441 | $67,066 | $0 | $0 |
Source: Public Records
Map
Nearby Homes