Estimated Value: $852,118 - $942,000
4
Beds
3
Baths
2,809
Sq Ft
$317/Sq Ft
Est. Value
About This Home
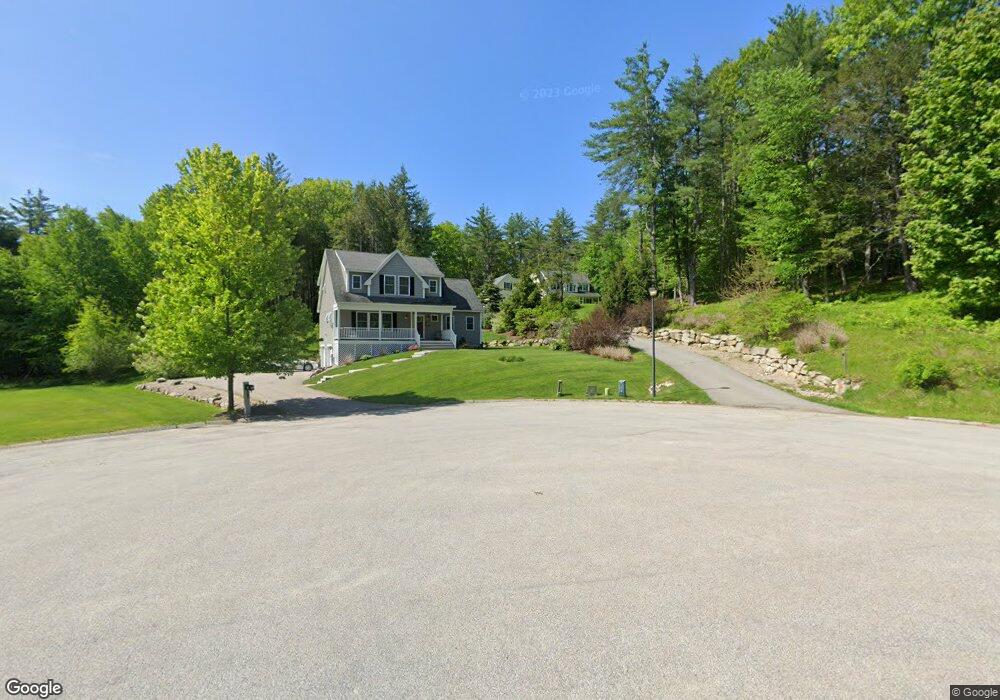
This home is located at 41 Nye Ln, Dover, NH 03820 and is currently estimated at $891,280, approximately $317 per square foot. 41 Nye Ln is a home located in Strafford County with nearby schools including Woodman Park School, Dover Middle School, and Dover Senior High School.
Ownership History
Date
Name
Owned For
Owner Type
Purchase Details
Closed on
Jun 27, 2022
Sold by
Anderson Adam and Anderson Rebecca
Bought by
Adam E & R T Anderson Ret and Anderson
Current Estimated Value
Purchase Details
Closed on
Feb 24, 2021
Sold by
Anderson Linda and Anderson Tony
Bought by
Anderson Adam and Anderson Rebecca
Home Financials for this Owner
Home Financials are based on the most recent Mortgage that was taken out on this home.
Original Mortgage
$365,000
Interest Rate
2.7%
Mortgage Type
New Conventional
Purchase Details
Closed on
Nov 3, 2016
Sold by
Varney Peter and Varney Yvette D
Bought by
Anderson Adam and Anderson Rebecca
Home Financials for this Owner
Home Financials are based on the most recent Mortgage that was taken out on this home.
Original Mortgage
$417,000
Interest Rate
2.76%
Mortgage Type
New Conventional
Purchase Details
Closed on
Jan 18, 2013
Sold by
Graystone Builders Inc
Bought by
Varney Yvette D and Varney Peter A
Create a Home Valuation Report for This Property
The Home Valuation Report is an in-depth analysis detailing your home's value as well as a comparison with similar homes in the area
Home Values in the Area
Average Home Value in this Area
Purchase History
We collect this data history from publicly available records. To have your information removed, we recommend requesting removal directly through your county’s website.
| Date | Buyer | Sale Price | Title Company |
|---|---|---|---|
| Adam E & R T Anderson Ret | -- | None Available | |
| Adam E & R T Anderson Ret | -- | None Available | |
| Anderson Adam | -- | None Available | |
| Anderson Adam | -- | None Available | |
| Anderson Adam | $450,000 | -- | |
| Anderson Adam | $450,000 | -- | |
| Anderson Adam | $450,000 | -- | |
| Varney Yvette D | $425,000 | -- | |
| Varney Yvette D | $425,000 | -- |
Source: Public Records
Mortgage History
We collect this data history from publicly available records. To have your information removed, we recommend requesting removal directly through your county’s website.
| Date | Status | Borrower | Loan Amount |
|---|---|---|---|
| Previous Owner | Anderson Adam | $365,000 | |
| Previous Owner | Anderson Adam | $417,000 | |
| Previous Owner | Varney Yvette D | $175,000 | |
| Closed | Varney Yvette D | $0 |
Source: Public Records
Tax History
| Year | Tax Paid | Tax Assessment Tax Assessment Total Assessment is a certain percentage of the fair market value that is determined by local assessors to be the total taxable value of land and additions on the property. | Land | Improvement |
|---|---|---|---|---|
| 2025 | $15,852 | $805,500 | $185,200 | $620,300 |
| 2024 | $14,636 | $805,500 | $185,200 | $620,300 |
| 2023 | $13,365 | $714,700 | $160,200 | $554,500 |
| 2022 | $13,094 | $660,000 | $160,200 | $499,800 |
| 2021 | $12,792 | $589,500 | $150,100 | $439,400 |
| 2020 | $12,770 | $513,900 | $150,100 | $363,800 |
| 2019 | $12,388 | $491,800 | $135,200 | $356,600 |
| 2018 | $11,683 | $468,800 | $115,100 | $353,700 |
| 2017 | $11,341 | $438,400 | $95,100 | $343,300 |
| 2016 | $11,213 | $426,500 | $105,100 | $321,400 |
| 2015 | $11,147 | $418,900 | $105,100 | $313,800 |
| 2014 | $10,896 | $418,900 | $105,100 | $313,800 |
| 2011 | $1,879 | $74,800 | $74,800 | $0 |
Source: Public Records
Map
Nearby Homes
Your Personal Tour Guide
Ask me questions while you tour the home.