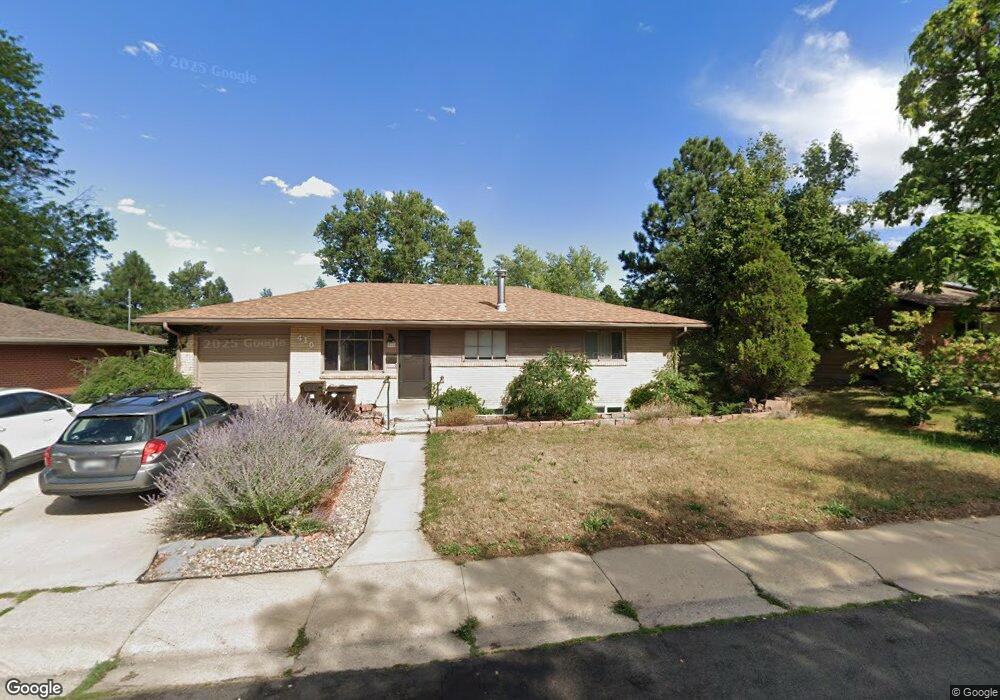
410 S 38th St Boulder, CO 80305
South Boulder NeighborhoodEstimated Value: $918,000 - $977,000
3
Beds
2
Baths
2,034
Sq Ft
$463/Sq Ft
Est. Value
About This Home
This home is located at 410 S 38th St, Boulder, CO 80305 and is currently estimated at $941,721, approximately $462 per square foot. 410 S 38th St is a home located in Boulder County with nearby schools including Creekside Elementary School, Manhattan Middle School of the Arts & Academics, and Fairview High School.
Ownership History
Date
Name
Owned For
Owner Type
Purchase Details
Closed on
Mar 22, 2013
Sold by
Grier Jamie
Bought by
Gansel Cheryl
Current Estimated Value
Purchase Details
Closed on
May 4, 2007
Sold by
Geiger Joseph J and Geiger Linda M
Bought by
Grier Jamie and Gansel Cheryl
Home Financials for this Owner
Home Financials are based on the most recent Mortgage that was taken out on this home.
Original Mortgage
$353,400
Interest Rate
6.16%
Mortgage Type
Unknown
Purchase Details
Closed on
Aug 29, 2006
Sold by
Offerle Herbert V
Bought by
Geiger Linda M
Create a Home Valuation Report for This Property
The Home Valuation Report is an in-depth analysis detailing your home's value as well as a comparison with similar homes in the area
Home Values in the Area
Average Home Value in this Area
Purchase History
| Date | Buyer | Sale Price | Title Company |
|---|---|---|---|
| Gansel Cheryl | -- | First American | |
| Grier Jamie | $372,500 | Chicago Title Co | |
| Grier Jamie | -- | Chicago Title Co | |
| Geiger Linda M | -- | Chicago Title Co |
Source: Public Records
Mortgage History
| Date | Status | Borrower | Loan Amount |
|---|---|---|---|
| Previous Owner | Grier Jamie | $353,400 |
Source: Public Records
Tax History Compared to Growth
Tax History
| Year | Tax Paid | Tax Assessment Tax Assessment Total Assessment is a certain percentage of the fair market value that is determined by local assessors to be the total taxable value of land and additions on the property. | Land | Improvement |
|---|---|---|---|---|
| 2025 | $5,732 | $60,444 | $35,975 | $24,469 |
| 2024 | $5,732 | $60,444 | $35,975 | $24,469 |
| 2023 | $5,632 | $65,218 | $42,150 | $26,753 |
| 2022 | $4,975 | $53,571 | $31,268 | $22,303 |
| 2021 | $4,744 | $55,112 | $32,168 | $22,944 |
| 2020 | $4,596 | $52,803 | $26,241 | $26,562 |
| 2019 | $4,526 | $52,803 | $26,241 | $26,562 |
| 2018 | $4,081 | $47,066 | $24,192 | $22,874 |
| 2017 | $3,953 | $52,035 | $26,746 | $25,289 |
| 2016 | $3,347 | $38,670 | $16,796 | $21,874 |
| 2015 | $3,170 | $31,688 | $16,238 | $15,450 |
| 2014 | $2,664 | $31,688 | $16,238 | $15,450 |
Source: Public Records
Map
Nearby Homes
- 450 S 40th St
- 450 S 41st St
- 3682 Chase Ct
- 4293 Graham Ct
- 2955 Stanford Ave
- 725 S 45th St
- 140 S Lashley Ln
- 3410 Ash Ave
- 960 Toedtli Dr
- 4255 Apache Rd
- 611 Tantra Dr
- 2585 Kohler Dr
- 325 Fox Ct
- 15 Pawnee Dr
- 4763 Tantra Dr Unit B
- 800 W Moorhead Cir Unit E
- 750 W Moorhead Cir Unit A
- 4350 Butler Cir
- 850 W Moorhead Cir Unit 3L
- 1019 Tantra Park Cir