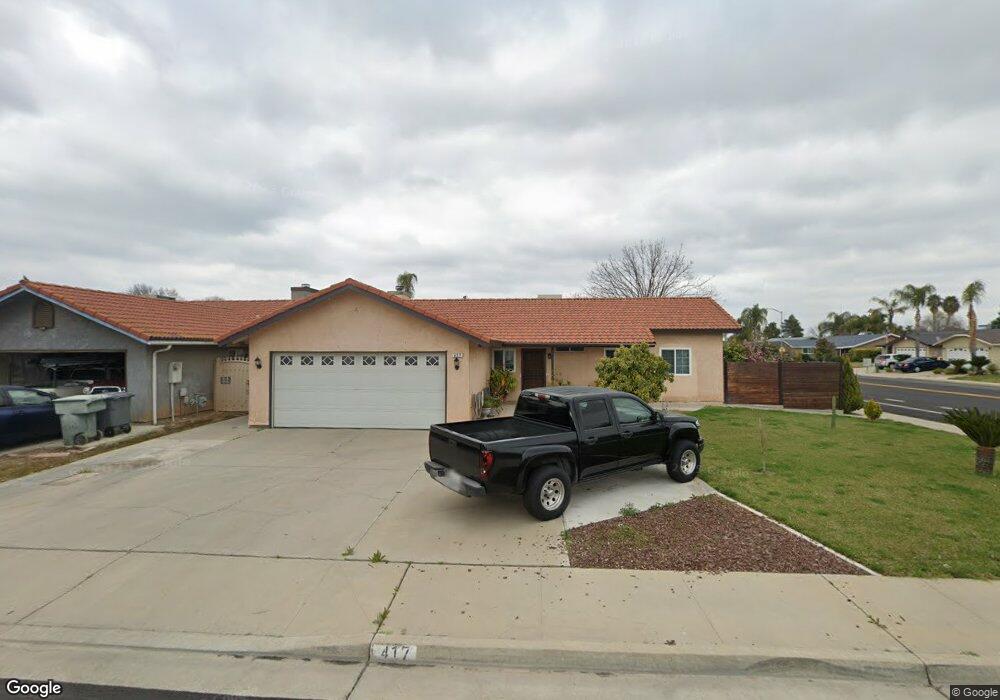
417 Faller Cir Sanger, CA 93657
Estimated Value: $283,517 - $296,000
3
Beds
2
Baths
1,104
Sq Ft
$264/Sq Ft
Est. Value
About This Home
This home is located at 417 Faller Cir, Sanger, CA 93657 and is currently estimated at $291,839, approximately $264 per square foot. 417 Faller Cir is a home located in Fresno County with nearby schools including Wilson Elementary School, Washington Academic Middle School, and Sanger High School.
Ownership History
Date
Name
Owned For
Owner Type
Purchase Details
Closed on
Nov 8, 2023
Sold by
Mendez Serafin and Mendez Maria A
Bought by
Mendez Cristina and Mendez Alma Rosa
Current Estimated Value
Purchase Details
Closed on
Aug 27, 1999
Sold by
Hud
Bought by
Mendez Serafin and Mendez Maria A
Home Financials for this Owner
Home Financials are based on the most recent Mortgage that was taken out on this home.
Original Mortgage
$68,395
Interest Rate
7.47%
Mortgage Type
FHA
Purchase Details
Closed on
Feb 8, 1999
Sold by
Midfirst Bank
Bought by
Hud
Purchase Details
Closed on
Jan 4, 1999
Sold by
Lopez Miguel A
Bought by
Midfirst Bank
Create a Home Valuation Report for This Property
The Home Valuation Report is an in-depth analysis detailing your home's value as well as a comparison with similar homes in the area
Home Values in the Area
Average Home Value in this Area
Purchase History
| Date | Buyer | Sale Price | Title Company |
|---|---|---|---|
| Mendez Cristina | -- | None Listed On Document | |
| Mendez Serafin | $72,000 | North American Title Co | |
| Hud | -- | United Title Company | |
| Midfirst Bank | $76,489 | United Title Company |
Source: Public Records
Mortgage History
| Date | Status | Borrower | Loan Amount |
|---|---|---|---|
| Previous Owner | Mendez Serafin | $68,395 |
Source: Public Records
Tax History
| Year | Tax Paid | Tax Assessment Tax Assessment Total Assessment is a certain percentage of the fair market value that is determined by local assessors to be the total taxable value of land and additions on the property. | Land | Improvement |
|---|---|---|---|---|
| 2025 | $1,415 | $117,188 | $45,208 | $71,980 |
| 2023 | $1,323 | $112,639 | $43,453 | $69,186 |
| 2022 | $1,301 | $110,431 | $42,601 | $67,830 |
| 2021 | $1,289 | $108,266 | $41,766 | $66,500 |
| 2020 | $1,251 | $107,157 | $41,338 | $65,819 |
| 2019 | $1,225 | $105,057 | $40,528 | $64,529 |
| 2018 | $1,173 | $102,998 | $39,734 | $63,264 |
| 2017 | $1,151 | $100,979 | $38,955 | $62,024 |
| 2016 | $1,081 | $99,000 | $38,192 | $60,808 |
| 2015 | $1,089 | $97,514 | $37,619 | $59,895 |
| 2014 | $1,073 | $95,605 | $36,883 | $58,722 |
Source: Public Records
Map
Nearby Homes
Your Personal Tour Guide
Ask me questions while you tour the home.