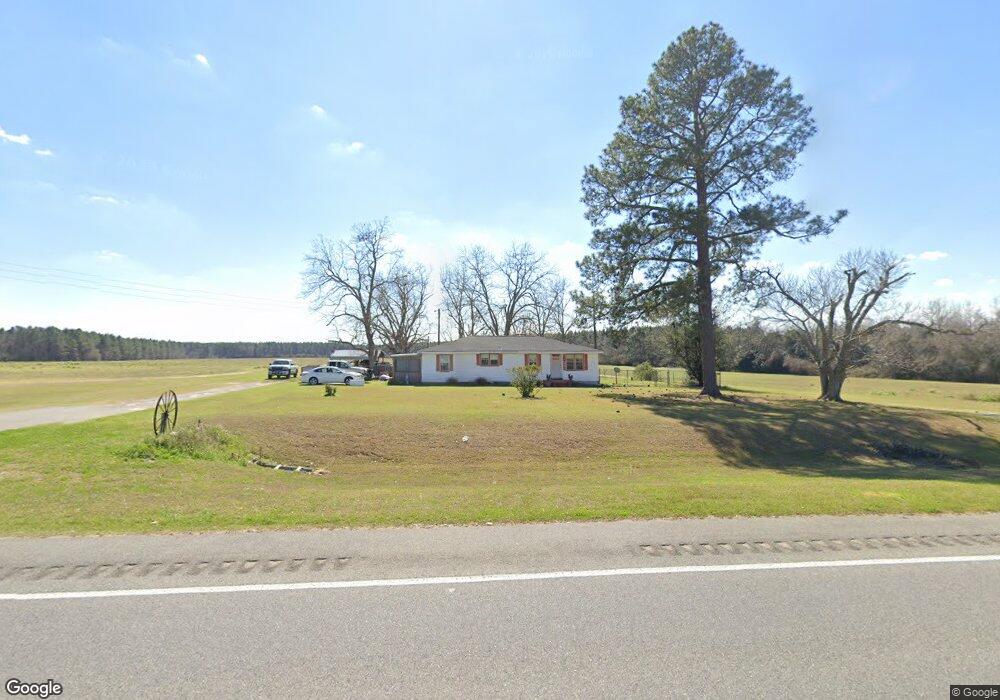
4184 Ga Highway 133 S Moultrie, GA 31788
Estimated Value: $231,000 - $397,000
3
Beds
2
Baths
1,433
Sq Ft
$217/Sq Ft
Est. Value
About This Home
This home is located at 4184 Ga Highway 133 S, Moultrie, GA 31788 and is currently estimated at $310,940, approximately $216 per square foot. 4184 Ga Highway 133 S is a home located in Colquitt County with nearby schools including Odom Elementary School, Willie J. Williams Middle School, and C.A. Gray Junior High School.
Ownership History
Date
Name
Owned For
Owner Type
Purchase Details
Closed on
Jan 6, 2022
Sold by
Ladson Jonathan D
Bought by
Ladson Jonathan D and Ladson David A
Current Estimated Value
Purchase Details
Closed on
Jan 22, 2014
Sold by
Huguet Day J
Bought by
Ladson Jonathan D and Johnson Lisa L
Purchase Details
Closed on
Mar 13, 2003
Sold by
Ladson Henrietta O
Bought by
Johnson Lisa L
Purchase Details
Closed on
Mar 3, 2003
Sold by
Ladson Max G
Bought by
Ladson Henrietta O
Purchase Details
Closed on
Dec 26, 2002
Bought by
Ladson Max G
Purchase Details
Closed on
May 21, 2001
Sold by
Tye Joseph K
Bought by
Huguet Day J
Purchase Details
Closed on
Sep 22, 1999
Sold by
Heath George
Bought by
Tye Joseph K
Purchase Details
Closed on
Aug 23, 1999
Bought by
Ladson Jonathan D
Purchase Details
Closed on
Aug 6, 1993
Bought by
Heath George
Purchase Details
Closed on
Jul 22, 1976
Bought by
Heath Gene
Create a Home Valuation Report for This Property
The Home Valuation Report is an in-depth analysis detailing your home's value as well as a comparison with similar homes in the area
Home Values in the Area
Average Home Value in this Area
Purchase History
| Date | Buyer | Sale Price | Title Company |
|---|---|---|---|
| Ladson Jonathan D | -- | -- | |
| Ladson Jonathan D | -- | -- | |
| Ladson Jonathan D | $130,000 | -- | |
| Johnson Lisa L | -- | -- | |
| Ladson Henrietta O | -- | -- | |
| Ladson Max G | -- | -- | |
| Huguet Day J | $82,000 | -- | |
| Tye Joseph K | $73,500 | -- | |
| Ladson Jonathan D | $1,400 | -- | |
| Heath George | -- | -- | |
| Heath Gene | -- | -- |
Source: Public Records
Tax History Compared to Growth
Tax History
| Year | Tax Paid | Tax Assessment Tax Assessment Total Assessment is a certain percentage of the fair market value that is determined by local assessors to be the total taxable value of land and additions on the property. | Land | Improvement |
|---|---|---|---|---|
| 2024 | $1,221 | $80,180 | $40,146 | $40,034 |
| 2023 | $1,155 | $71,294 | $40,146 | $31,148 |
| 2022 | $985 | $67,402 | $39,672 | $27,730 |
| 2021 | $894 | $57,831 | $34,310 | $23,521 |
| 2020 | $863 | $56,221 | $34,310 | $21,911 |
| 2019 | $922 | $55,148 | $34,310 | $20,838 |
| 2018 | $1,411 | $55,148 | $34,310 | $20,838 |
| 2017 | $889 | $49,860 | $29,022 | $20,838 |
| 2016 | $894 | $49,860 | $29,022 | $20,838 |
| 2015 | $894 | $49,860 | $29,022 | $20,838 |
| 2014 | -- | $44,854 | $24,869 | $19,985 |
| 2013 | -- | $44,882 | $24,898 | $19,984 |
Source: Public Records
Map
Nearby Homes
- 277 Indian Creek Subdivision
- 2262 Sardis Church Rd
- 0 Upper Trail Unit 913421
- 0 Upper Trail Unit 913422
- 5808 Georgia 133
- 1114 Cannon Rd
- 313 Langford St
- 182 Horseshoe Dr
- 410 Railroad St
- 0 Southerland Ave
- 0 Sardis Church Rd
- 5940 Georgia 37
- 124 Flint Dr
- 132 Tallokas Trail
- 270 Old Timey Trail
- 1113 Georgia 133
- 410 Indian Trail
- 8774 Antioch Rd
- 0 Old Timey Trail
- 292 Robin Ln
- 4184 Ga Highway 133 S
- 4184 Ga Highway 133 S
- 409 Ga Highway 133 Rd S
- 3945 Ga Highway 133 S
- 237 Cole Rd
- 265 Cole Rd
- 337 Cole Rd
- 140 Perry Rd
- 355 Cole Rd
- 4582 Ga Highway 133 S
- 377 Cole Rd
- 4606 Ga Highway 133 S
- 397 Cole Rd
- 451 Cole Rd
- 3549 Sardis Church Rd
- 443 Weathers Rd
- 7849 Old Adel Rd
- 3035 Sardis Church Rd
- 877 Gibbs Rd