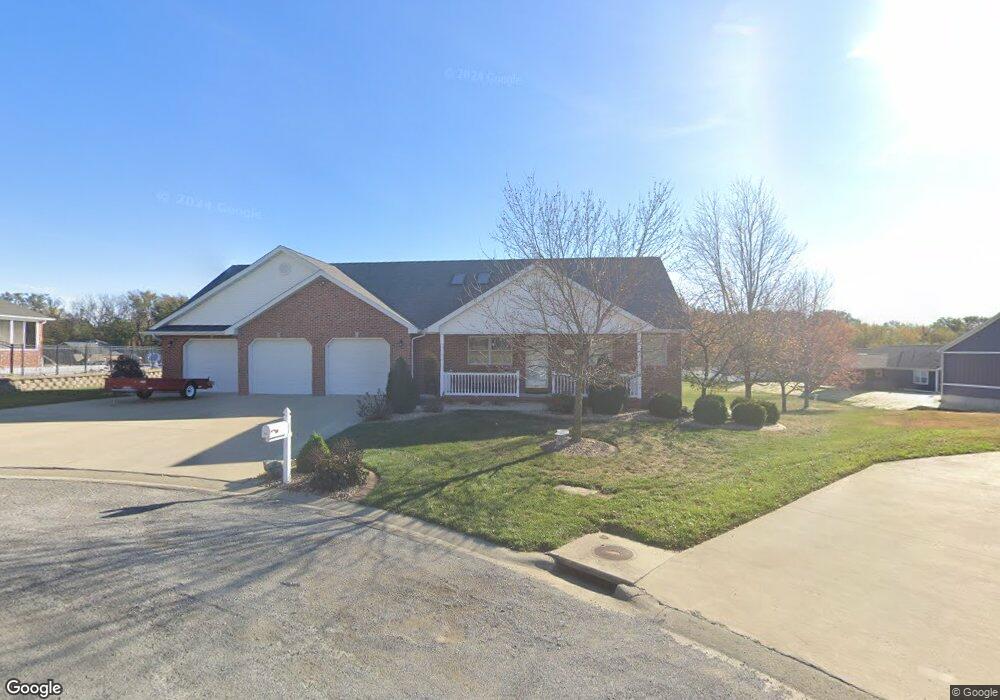
421 E 3rd St Aviston, IL 62216
Estimated Value: $342,000 - $423,000
4
Beds
3
Baths
1,920
Sq Ft
$199/Sq Ft
Est. Value
About This Home
This home is located at 421 E 3rd St, Aviston, IL 62216 and is currently estimated at $382,733, approximately $199 per square foot. 421 E 3rd St is a home located in Clinton County with nearby schools including Aviston Elementary School, Central Community High School, and All Saints Academy.
Ownership History
Date
Name
Owned For
Owner Type
Purchase Details
Closed on
Nov 21, 2005
Sold by
Kalmer Leonard
Bought by
Liening Mark J and Liening Stacy A
Current Estimated Value
Home Financials for this Owner
Home Financials are based on the most recent Mortgage that was taken out on this home.
Original Mortgage
$18,400
Interest Rate
5.75%
Mortgage Type
Purchase Money Mortgage
Create a Home Valuation Report for This Property
The Home Valuation Report is an in-depth analysis detailing your home's value as well as a comparison with similar homes in the area
Purchase History
| Date | Buyer | Sale Price | Title Company |
|---|---|---|---|
| Liening Mark J | -- | None Available |
Source: Public Records
Mortgage History
| Date | Status | Borrower | Loan Amount |
|---|---|---|---|
| Closed | Liening Mark J | $18,400 |
Source: Public Records
Tax History
| Year | Tax Paid | Tax Assessment Tax Assessment Total Assessment is a certain percentage of the fair market value that is determined by local assessors to be the total taxable value of land and additions on the property. | Land | Improvement |
|---|---|---|---|---|
| 2024 | $7,407 | $121,570 | $12,870 | $108,700 |
| 2023 | $7,407 | $114,690 | $12,140 | $102,550 |
| 2022 | $7,132 | $106,260 | $10,960 | $95,300 |
| 2021 | $6,150 | $101,200 | $10,440 | $90,760 |
| 2020 | $6,124 | $97,310 | $10,040 | $87,270 |
| 2019 | $6,098 | $97,310 | $10,040 | $87,270 |
| 2018 | $6,019 | $92,085 | $9,282 | $82,803 |
| 2017 | $5,874 | $87,700 | $8,840 | $78,860 |
| 2016 | $5,901 | $87,700 | $8,840 | $78,860 |
| 2015 | $5,487 | $87,700 | $8,840 | $78,860 |
| 2013 | $5,487 | $91,020 | $8,350 | $82,670 |
Source: Public Records
Map
Nearby Homes
- 15 Rosewood Ln
- 51 W Logan St
- 4650 Wyatt Way
- 12702 Crestview Ln
- 12746 Rolling Hills Dr
- 8011 von Bokel Dr
- 3337 Heavenly Dr
- 3265 Venhaus Rd
- 1144 Emily Ln
- 630 Wedgewood Ln
- 501 Wedgewood Ln
- 525 Wedgewood Ln
- 607 Wedgewood Ln
- 619 Wedgewood Ln
- 437 Galen Dr
- 679 Galen Dr
- 265 N 1st St
- 1251 Sunset Dr
- 337 N 2nd St
- 1059 N Cherry St
Your Personal Tour Guide
Ask me questions while you tour the home.