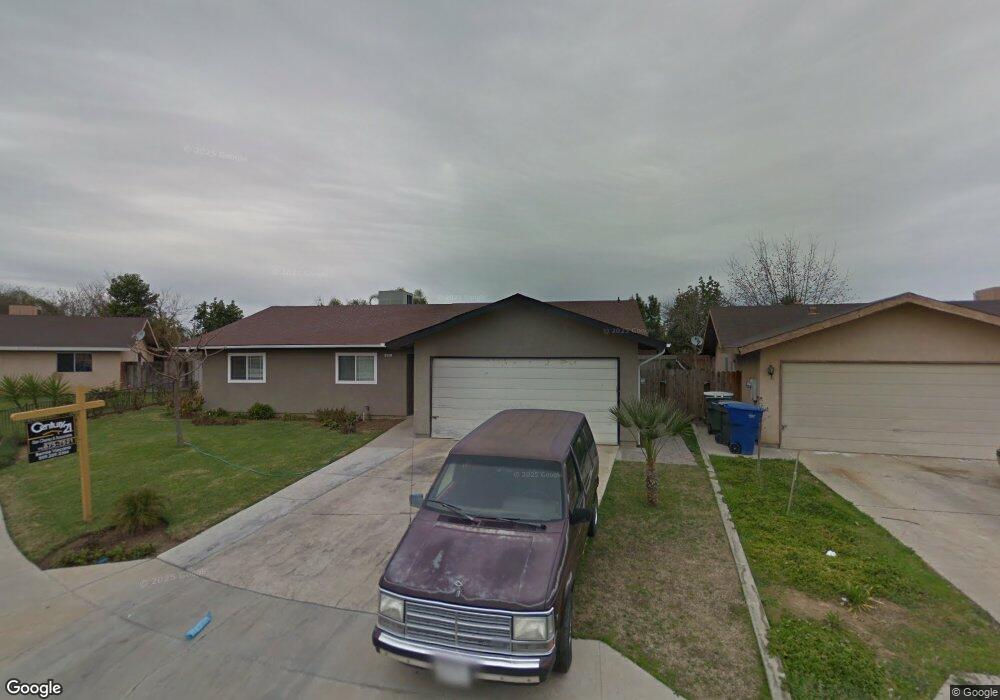
421 Recreation Cir Sanger, CA 93657
Estimated Value: $318,082 - $368,000
4
Beds
2
Baths
1,500
Sq Ft
$224/Sq Ft
Est. Value
About This Home
This home is located at 421 Recreation Cir, Sanger, CA 93657 and is currently estimated at $336,521, approximately $224 per square foot. 421 Recreation Cir is a home located in Fresno County with nearby schools including Wilson Elementary School, Washington Academic Middle School, and Sanger High School.
Ownership History
Date
Name
Owned For
Owner Type
Purchase Details
Closed on
Jan 4, 2012
Sold by
Pennymac Mortgage Investment Trust Holdi
Bought by
Rosales Veronica M
Current Estimated Value
Home Financials for this Owner
Home Financials are based on the most recent Mortgage that was taken out on this home.
Original Mortgage
$107,211
Interest Rate
4.5%
Mortgage Type
FHA
Purchase Details
Closed on
Sep 14, 2011
Sold by
Sanchez Raul and Sanchez Phyllis
Bought by
Pennymac Mortgage Investment Trust Holdi
Purchase Details
Closed on
May 1, 2003
Sold by
Housing Authority Of Fresno County
Bought by
Sanchez Raul and Sanchez Phyllis
Home Financials for this Owner
Home Financials are based on the most recent Mortgage that was taken out on this home.
Original Mortgage
$81,700
Interest Rate
5.84%
Purchase Details
Closed on
Jun 20, 1994
Sold by
Cervantes John M and Cervantes Martha F
Bought by
Housing Authority Of Fresno County
Create a Home Valuation Report for This Property
The Home Valuation Report is an in-depth analysis detailing your home's value as well as a comparison with similar homes in the area
Home Values in the Area
Average Home Value in this Area
Purchase History
We collect this data history from publicly available records. To have your information removed, we recommend requesting removal directly through your county’s website.
| Date | Buyer | Sale Price | Title Company |
|---|---|---|---|
| Rosales Veronica M | $120,000 | Lsi Title Company | |
| Pennymac Mortgage Investment Trust Holdi | $107,000 | None Available | |
| Sanchez Raul | $86,000 | Stewart Title Of Fresno Cnty | |
| Housing Authority Of Fresno County | $90,000 | Central Title Company |
Source: Public Records
Mortgage History
We collect this data history from publicly available records. To have your information removed, we recommend requesting removal directly through your county’s website.
| Date | Status | Borrower | Loan Amount |
|---|---|---|---|
| Previous Owner | Rosales Veronica M | $107,211 | |
| Previous Owner | Sanchez Raul | $81,700 |
Source: Public Records
Tax History
| Year | Tax Paid | Tax Assessment Tax Assessment Total Assessment is a certain percentage of the fair market value that is determined by local assessors to be the total taxable value of land and additions on the property. | Land | Improvement |
|---|---|---|---|---|
| 2025 | $1,837 | $150,712 | $31,394 | $119,318 |
| 2023 | $1,717 | $144,862 | $30,176 | $114,686 |
| 2022 | $1,690 | $142,023 | $29,585 | $112,438 |
| 2021 | $1,675 | $139,239 | $29,005 | $110,234 |
| 2020 | $1,625 | $137,812 | $28,708 | $109,104 |
| 2019 | $1,591 | $135,111 | $28,146 | $106,965 |
| 2018 | $1,524 | $132,463 | $27,595 | $104,868 |
| 2017 | $1,496 | $129,866 | $27,054 | $102,812 |
| 2016 | $1,405 | $127,321 | $26,524 | $100,797 |
| 2015 | $1,416 | $125,409 | $26,126 | $99,283 |
| 2014 | $1,395 | $122,954 | $25,615 | $97,339 |
Source: Public Records
Map
Nearby Homes
- 417 Recreation Cir
- 425 Recreation Cir
- 365 Recreation Ct
- 361 Recreation Ct
- 369 Recreation Ct
- 373 Recreation Ct
- 429 Recreation Cir
- 441 Recreation Cir
- 437 Recreation Cir
- 418 Recreation Ave
- 426 Recreation Ave
- 433 Recreation Cir
- 408 Recreation Ave
- 436 Recreation Ave
- 357 Recreation Ct
- 406 Faller Ave
- 370 Recreation Ave
- 416 Faller Ave
- 360 Faller Ave
- 446 Recreation Ave
Your Personal Tour Guide
Ask me questions while you tour the home.