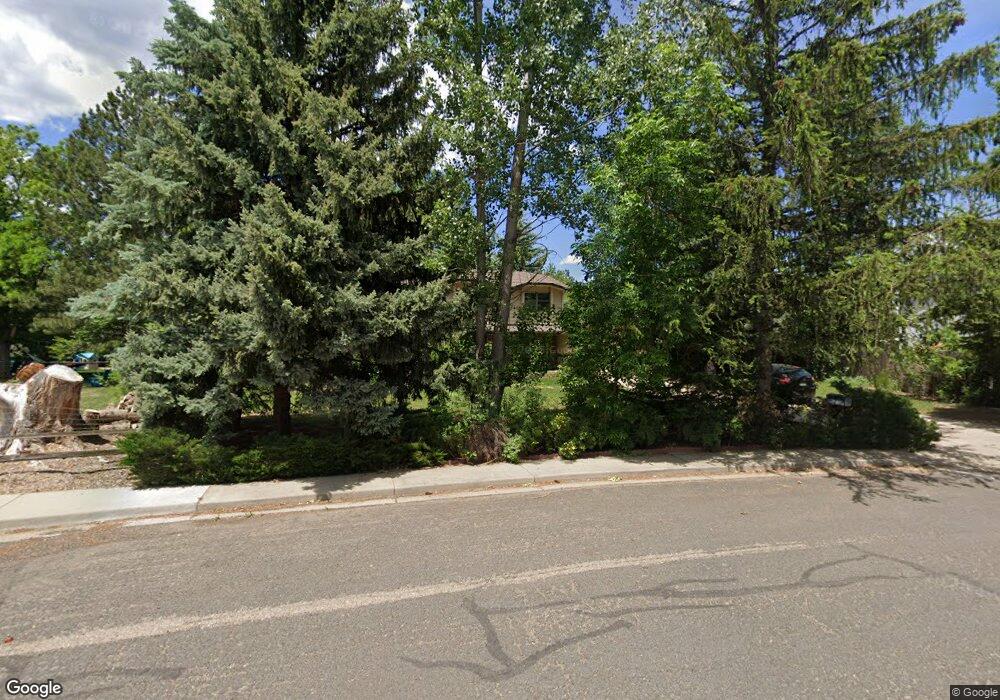
4210 Peach Way Boulder, CO 80301
Estimated Value: $1,422,000 - $1,542,000
4
Beds
3
Baths
2,442
Sq Ft
$601/Sq Ft
Est. Value
About This Home
This home is located at 4210 Peach Way, Boulder, CO 80301 and is currently estimated at $1,466,646, approximately $600 per square foot. 4210 Peach Way is a home located in Boulder County with nearby schools including Crest View Elementary School, Centennial Middle School, and Boulder High School.
Ownership History
Date
Name
Owned For
Owner Type
Purchase Details
Closed on
Jun 24, 2004
Sold by
Znd Property Llc
Bought by
Zirakzadeh Manouchehr
Current Estimated Value
Purchase Details
Closed on
Jul 27, 2001
Sold by
Wilson Lucy E
Bought by
Znd Property Llc
Purchase Details
Closed on
Dec 4, 2000
Sold by
L E Wilson Trust The
Bought by
Wilson Lucy E
Home Financials for this Owner
Home Financials are based on the most recent Mortgage that was taken out on this home.
Original Mortgage
$250,000
Interest Rate
7.72%
Mortgage Type
Credit Line Revolving
Purchase Details
Closed on
Sep 9, 1993
Sold by
Ries Mary E
Bought by
Wilson Lucy E
Purchase Details
Closed on
Feb 9, 1993
Sold by
L E Wilson Trust
Bought by
Wilson Lucy E
Home Financials for this Owner
Home Financials are based on the most recent Mortgage that was taken out on this home.
Original Mortgage
$122,000
Interest Rate
7.25%
Create a Home Valuation Report for This Property
The Home Valuation Report is an in-depth analysis detailing your home's value as well as a comparison with similar homes in the area
Purchase History
| Date | Buyer | Sale Price | Title Company |
|---|---|---|---|
| Zirakzadeh Manouchehr | -- | -- | |
| Znd Property Llc | $500,000 | Land Title | |
| Wilson Lucy E | -- | -- | |
| Wilson Lucy E | -- | -- | |
| Wilson Lucy E | -- | -- |
Source: Public Records
Mortgage History
| Date | Status | Borrower | Loan Amount |
|---|---|---|---|
| Previous Owner | Wilson Lucy E | $250,000 | |
| Previous Owner | Wilson Lucy E | $122,000 |
Source: Public Records
Tax History
| Year | Tax Paid | Tax Assessment Tax Assessment Total Assessment is a certain percentage of the fair market value that is determined by local assessors to be the total taxable value of land and additions on the property. | Land | Improvement |
|---|---|---|---|---|
| 2025 | $9,883 | $92,257 | $22,444 | $69,813 |
| 2024 | $9,883 | $92,257 | $22,444 | $69,813 |
| 2023 | $9,720 | $107,086 | $15,544 | $95,227 |
| 2022 | $7,694 | $79,008 | $12,503 | $66,505 |
| 2021 | $7,335 | $81,281 | $12,863 | $68,418 |
| 2020 | $5,974 | $65,423 | $18,948 | $46,475 |
| 2019 | $5,884 | $65,423 | $18,948 | $46,475 |
| 2018 | $5,279 | $58,025 | $16,560 | $41,465 |
| 2017 | $5,122 | $64,150 | $18,308 | $45,842 |
| 2016 | $5,149 | $56,659 | $17,830 | $38,829 |
| 2015 | $4,889 | $50,920 | $29,372 | $21,548 |
| 2014 | $4,671 | $50,920 | $29,372 | $21,548 |
Source: Public Records
Map
Nearby Homes
- 4556 Apple Way
- 4141 Saint Croix St
- 4591 Sunnyside Place Unit D
- 4190 Longview Ln
- 4150 Longview Ln
- 4125 47th St Unit C
- 3865 Campo Ct
- 3862 Campo Ct
- 4624 S Hampton Cir
- 4268 Corriente Place
- 4258 Corriente Place Unit D3
- 4139 Autumn Ct
- 4072 Crystal Ct
- 3683 Pinedale St Unit F
- 3668 Pinedale St
- 4149 Amber St
- 2734 Northbrook Place
- 3663 Silverton St
- 2715 Northbrook Place
- 3618 Paonia St
Your Personal Tour Guide
Ask me questions while you tour the home.