
4213 N Westview Dr Phoenix, AZ 85015
5
Beds
4
Baths
2,700
Sq Ft
8,742
Sq Ft Lot
Highlights
- Guest House
- Property is near public transit
- No HOA
- Phoenix Coding Academy Rated A
- Granite Countertops
- No Interior Steps
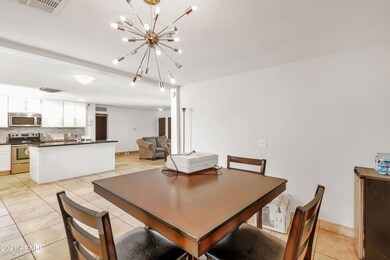
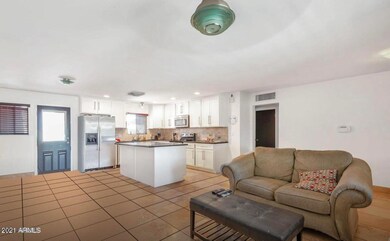
About This Home
As of February 2022Amazing home with guesthouse available! Multiple opportunities for Airbnb, extra rental income, in-laws! Located in highly desirable Bel Air district in central Phoenix, just minutes from downtown, Melrose District, Encanto Park!
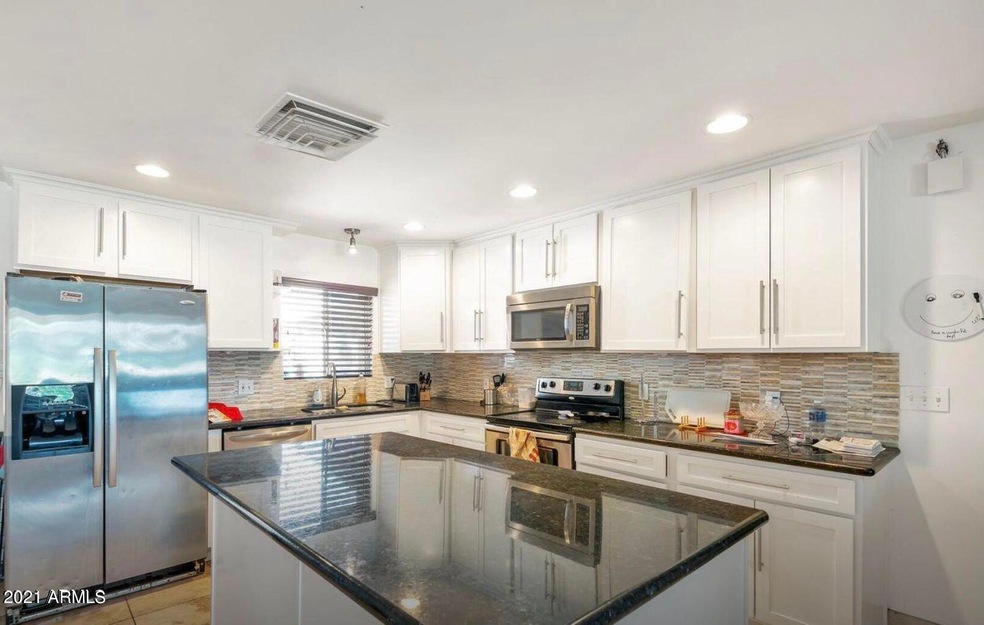
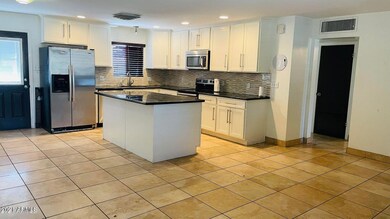
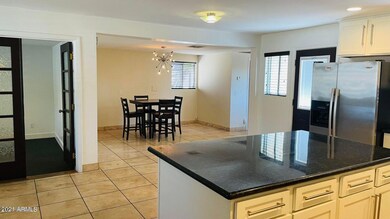
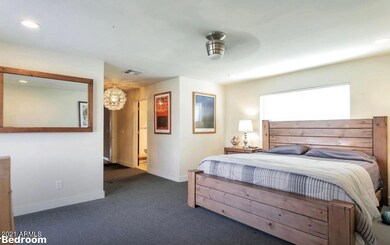
The expansive 4 bedroom, 3 bath main house features a split bedroom floorplan, master suite opening to the backyard, an oversized kitchen with black granite countertops, full backsplash and island. Huge bonus room with separate entrance. Other upgrades include granite countertops in the bathrooms, tile showers, stone floors throughout, walk in closets and more.
The newly remodeled casita features an oversized patio, full bath, fully equipped kitchen. Bring your toys - there's no HOA!!
Last Buyer's Agent
Tracey Couture
Arizona Gateway Real Estate License #BR579005000
Home Details
Home Type
- Single Family
Est. Annual Taxes
- $1,799
Year Built
- Built in 1956
Lot Details
- 8,742 Sq Ft Lot
- Block Wall Fence
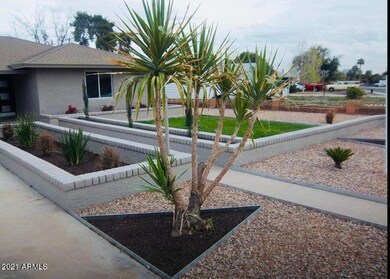
- Grass Covered Lot
Parking
- 4 Open Parking Spaces
Home Design
- Wood Frame Construction
- Composition Roof
- Stucco
Interior Spaces
- 2,700 Sq Ft Home
- 1-Story Property
- Ceiling height of 9 feet or more
Kitchen
- Built-In Microwave
- Kitchen Island
- Granite Countertops
Flooring
- Carpet
- Stone
Bedrooms and Bathrooms
- 5 Bedrooms
- Primary Bathroom is a Full Bathroom
- 4 Bathrooms
Schools
- Encanto Elementary School
- Osborn Middle School
- Central High School
Utilities
- Refrigerated Cooling System
- Heating Available
- High Speed Internet
- Cable TV Available
Additional Features
- No Interior Steps
- Guest House
- Property is near public transit
Community Details
- No Home Owners Association
- Association fees include no fees
- Built by Womack
- Bel Air Blk 10_& 11 Subdivision
Listing and Financial Details
- Legal Lot and Block 32 / 4
- Assessor Parcel Number 155-48-087
Ownership History
Date
Name
Owned For
Owner Type
Purchase Details
Listed on
Feb 25, 2022
Closed on
Feb 9, 2022
Sold by
Deborah Simons
Bought by
Boynerian Arek and Boynerian Avedis
Seller's Agent
Michael Hoffman
HomeSmart
Buyer's Agent
Michael Hoffman
HomeSmart
Sold Price
$4,000
Total Days on Market
76
Home Financials for this Owner
Home Financials are based on the most recent Mortgage that was taken out on this home.
Avg. Annual Appreciation
1.01%
Original Mortgage
$545,369
Outstanding Balance
$511,204
Interest Rate
3.55%
Mortgage Type
New Conventional
Estimated Equity
$81,792
Purchase Details
Listed on
Jun 13, 2017
Closed on
Apr 12, 2018
Sold by
Simons Julia Ellen and Dudding Bradley
Bought by
Dudding Bradley
Seller's Agent
Omar Vasquez
A.Z. & Associates
Buyer's Agent
Mary Thompson
Realty East, Incorporated
List Price
$320,000
Sold Price
$315,000
Premium/Discount to List
-$5,000
-1.56%
Home Financials for this Owner
Home Financials are based on the most recent Mortgage that was taken out on this home.
Avg. Annual Appreciation
16.73%
Original Mortgage
$299,250
Interest Rate
4.43%
Mortgage Type
New Conventional
Purchase Details
Listed on
Dec 31, 2014
Closed on
Apr 28, 2015
Sold by
Martinez Tania Alaman and Galvez Oscar Omar Barragan
Bought by
Galvez Oscar Omar Barragan and Martinez Tania Alaman
Seller's Agent
Rocio Baez
Camelback Executive Realtors
Buyer's Agent
Omar Vasquez
A.Z. & Associates
List Price
$275,000
Sold Price
$264,900
Premium/Discount to List
-$10,100
-3.67%
Home Financials for this Owner
Home Financials are based on the most recent Mortgage that was taken out on this home.
Avg. Annual Appreciation
6.05%
Original Mortgage
$260,073
Interest Rate
4.4%
Mortgage Type
FHA
Purchase Details
Listed on
Jan 27, 2012
Closed on
Jun 19, 2012
Sold by
Luca Fred
Bought by
Montoya Johnnie M and Montoya Maria
Seller's Agent
Angela Turner
Turner International Real Estate
Buyer's Agent
Rocio Baez
Camelback Executive Realtors
List Price
$247,500
Sold Price
$235,000
Premium/Discount to List
-$12,500
-5.05%
Home Financials for this Owner
Home Financials are based on the most recent Mortgage that was taken out on this home.
Avg. Annual Appreciation
4.34%
Original Mortgage
$230,743
Interest Rate
3.74%
Mortgage Type
New Conventional
Purchase Details
Closed on
Jun 3, 2011
Sold by
Ruiz Alma De Jesus
Bought by
Gmac Mortgage Llc and Gmac Mortgage Corporation
Purchase Details
Closed on
May 24, 2011
Sold by
Gmac Mortgage Llc
Bought by
Luca Fred
Purchase Details
Closed on
Jun 28, 2006
Sold by
Leach Janis M
Bought by
Ruiz Alma Jesus
Home Financials for this Owner
Home Financials are based on the most recent Mortgage that was taken out on this home.
Original Mortgage
$43,900
Interest Rate
6.66%
Mortgage Type
Stand Alone Second
Map
Create a Home Valuation Report for This Property
The Home Valuation Report is an in-depth analysis detailing your home's value as well as a comparison with similar homes in the area
Similar Homes in the area
Home Values in the Area
Average Home Value in this Area
Purchase History
| Date | Type | Sale Price | Title Company |
|---|---|---|---|
| Warranty Deed | $574,073 | Magnus Title | |
| Interfamily Deed Transfer | -- | Security Title Agency Inc | |
| Warranty Deed | $315,000 | Security Title Agency Inc | |
| Interfamily Deed Transfer | -- | Security Title Agency Inc | |
| Warranty Deed | $264,900 | Security Title Agency Inc | |
| Special Warranty Deed | $235,000 | Security Title Agency | |
| Trustee Deed | $76,500 | Security Title Agency | |
| Cash Sale Deed | $77,500 | First American Title Ins Co | |
| Warranty Deed | $439,000 | Camelback Title Agency Llc |
Source: Public Records
Mortgage History
| Date | Status | Loan Amount | Loan Type |
|---|---|---|---|
| Open | $545,369 | New Conventional | |
| Previous Owner | $300,000 | New Conventional | |
| Previous Owner | $299,250 | New Conventional | |
| Previous Owner | $260,073 | FHA | |
| Previous Owner | $230,743 | New Conventional | |
| Previous Owner | $43,900 | Stand Alone Second | |
| Previous Owner | $351,200 | Purchase Money Mortgage |
Source: Public Records
Property History
| Date | Event | Price | Change | Sq Ft Price |
|---|---|---|---|---|
| 05/12/2025 05/12/25 | For Sale | $725,000 | 0.0% | $269 / Sq Ft |
| 04/17/2025 04/17/25 | Price Changed | $4,000 | -3.6% | $1 / Sq Ft |
| 02/12/2025 02/12/25 | For Rent | $4,150 | +3.8% | -- |
| 03/15/2022 03/15/22 | Rented | $4,000 | +2.6% | -- |
| 03/11/2022 03/11/22 | Under Contract | -- | -- | -- |
| 02/25/2022 02/25/22 | For Rent | $3,900 | 0.0% | -- |
| 02/23/2022 02/23/22 | Sold | $574,073 | -0.2% | $213 / Sq Ft |
| 01/06/2022 01/06/22 | Pending | -- | -- | -- |
| 12/15/2021 12/15/21 | Price Changed | $575,000 | -4.0% | $213 / Sq Ft |
| 10/27/2021 10/27/21 | For Sale | $599,000 | +4.3% | $222 / Sq Ft |
| 10/23/2021 10/23/21 | Off Market | $574,073 | -- | -- |
| 10/22/2021 10/22/21 | For Sale | $599,000 | +90.2% | $222 / Sq Ft |
| 04/10/2018 04/10/18 | Sold | $315,000 | -1.6% | $117 / Sq Ft |
| 04/03/2018 04/03/18 | For Sale | $320,000 | 0.0% | $119 / Sq Ft |
| 04/03/2018 04/03/18 | Price Changed | $320,000 | 0.0% | $119 / Sq Ft |
| 02/15/2018 02/15/18 | Pending | -- | -- | -- |
| 01/02/2018 01/02/18 | For Sale | $320,000 | +1.6% | $119 / Sq Ft |
| 12/30/2017 12/30/17 | Off Market | $315,000 | -- | -- |
| 10/11/2017 10/11/17 | Price Changed | $320,000 | -3.0% | $119 / Sq Ft |
| 06/27/2017 06/27/17 | Price Changed | $330,000 | -1.5% | $122 / Sq Ft |
| 06/13/2017 06/13/17 | For Sale | $335,000 | +26.5% | $124 / Sq Ft |
| 04/28/2015 04/28/15 | Sold | $264,900 | 0.0% | $98 / Sq Ft |
| 03/06/2015 03/06/15 | Pending | -- | -- | -- |
| 03/02/2015 03/02/15 | Price Changed | $264,900 | -1.9% | $98 / Sq Ft |
| 01/09/2015 01/09/15 | Price Changed | $269,900 | -1.9% | $100 / Sq Ft |
| 12/31/2014 12/31/14 | For Sale | $275,000 | +17.0% | $102 / Sq Ft |
| 07/02/2012 07/02/12 | Sold | $235,000 | -4.1% | $87 / Sq Ft |
| 06/11/2012 06/11/12 | Pending | -- | -- | -- |
| 05/01/2012 05/01/12 | Price Changed | $245,000 | -1.0% | $91 / Sq Ft |
| 04/05/2012 04/05/12 | For Sale | $247,500 | 0.0% | $92 / Sq Ft |
| 02/22/2012 02/22/12 | Pending | -- | -- | -- |
| 02/16/2012 02/16/12 | Price Changed | $247,500 | -1.0% | $92 / Sq Ft |
| 01/27/2012 01/27/12 | For Sale | $249,900 | -- | $93 / Sq Ft |
Source: Arizona Regional Multiple Listing Service (ARMLS)
Tax History
| Year | Tax Paid | Tax Assessment Tax Assessment Total Assessment is a certain percentage of the fair market value that is determined by local assessors to be the total taxable value of land and additions on the property. | Land | Improvement |
|---|---|---|---|---|
| 2025 | $2,074 | $16,526 | -- | -- |
| 2024 | $1,755 | $15,739 | -- | -- |
| 2023 | $1,755 | $37,430 | $7,480 | $29,950 |
| 2022 | $1,748 | $31,020 | $6,200 | $24,820 |
| 2021 | $1,799 | $27,930 | $5,580 | $22,350 |
| 2020 | $1,750 | $26,710 | $5,340 | $21,370 |
| 2019 | $1,669 | $23,400 | $4,680 | $18,720 |
| 2018 | $1,609 | $23,230 | $4,640 | $18,590 |
| 2017 | $1,463 | $22,000 | $4,400 | $17,600 |
| 2016 | $1,409 | $18,160 | $3,630 | $14,530 |
| 2015 | $1,312 | $17,870 | $3,570 | $14,300 |
Source: Public Records
Source: Arizona Regional Multiple Listing Service (ARMLS)
MLS Number: 6311569
APN: 155-48-087
Disclaimer: Certain information contained herein is derived from information provided by parties other than Homes.com. All information provided is deemed reliable, but is not guaranteed to be accurate and should be independently verified.
![]() All information should be verified by the recipient and none is guaranteed as accurate by ARMLS
All information should be verified by the recipient and none is guaranteed as accurate by ARMLS
Listing Information presented by local MLS brokerage: Ten-X, local REALTOR®- Arlene Richardson - (888)-952-6393
Nearby Homes
- 4245 N 16th Dr
- 1702 W Glenrosa Ave
- 1749 W Monterosa St
- 1734 W Glenrosa Ave
- 4307 N 15th Dr
- 4333 N 15th Dr
- 4127 N 19th Ave
- 4125 N 19th Ave
- 1644 W Roma Ave
- 1306 W Heatherbrae Dr
- 1305 W Glenrosa Ave
- 4250 N 19th Ave
- 1736 W Indianola Ave
- 1837 W Roma Ave
- 4502 N 17th Ave
- 1141 W Monterosa St
- 4019 N 14th Ave
- 1578 W Campbell Ave
- 1334 W Sells Dr
- 1701 W Clarendon Ave