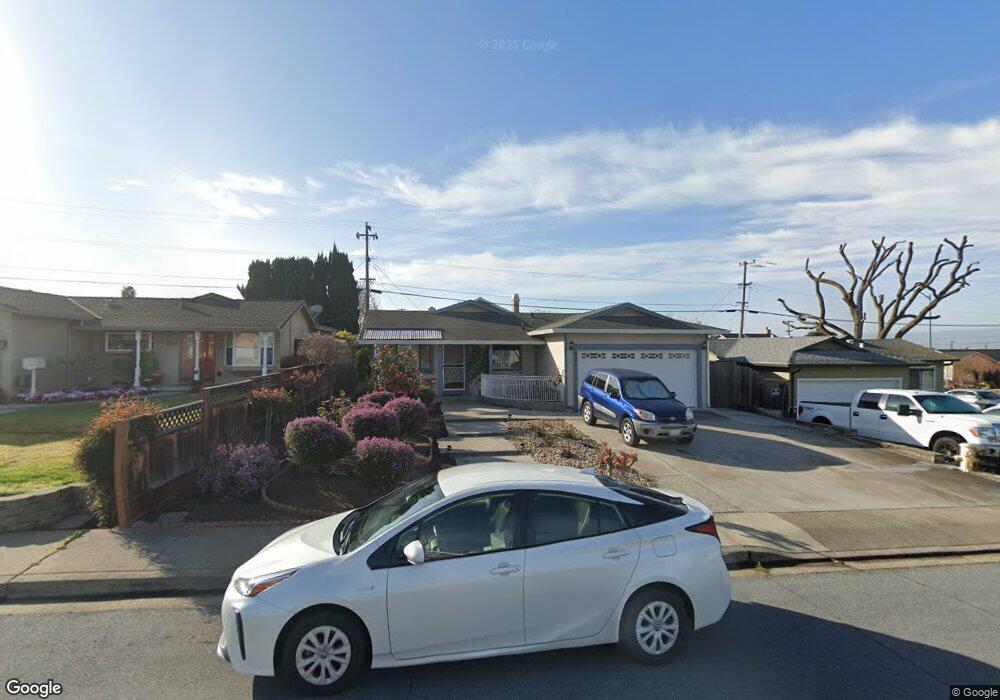
422 Dixon Rd Milpitas, CA 95035
Estimated Value: $1,314,000 - $1,744,000
3
Beds
2
Baths
1,085
Sq Ft
$1,386/Sq Ft
Est. Value
About This Home
This home is located at 422 Dixon Rd, Milpitas, CA 95035 and is currently estimated at $1,503,522, approximately $1,385 per square foot. 422 Dixon Rd is a home located in Santa Clara County with nearby schools including Joseph Weller Elementary School, Thomas Russell Middle School, and Milpitas High School.
Ownership History
Date
Name
Owned For
Owner Type
Purchase Details
Closed on
Mar 5, 2001
Sold by
Ahad Rafiul and Ahad Frances K
Bought by
Kasala Naneth G
Current Estimated Value
Home Financials for this Owner
Home Financials are based on the most recent Mortgage that was taken out on this home.
Original Mortgage
$209,000
Outstanding Balance
$76,615
Interest Rate
7.11%
Estimated Equity
$1,426,907
Purchase Details
Closed on
Jul 13, 1998
Sold by
Wallace Earl M and Wallace Lisa A
Bought by
Ahad Rafiul and Ahad Frances K
Home Financials for this Owner
Home Financials are based on the most recent Mortgage that was taken out on this home.
Original Mortgage
$212,800
Interest Rate
6.93%
Purchase Details
Closed on
Mar 29, 1994
Sold by
Voorhoeve Marc A and Voorhoeve Evelyn
Bought by
Wallace Earl Mark and Wallace Lisa Ann
Home Financials for this Owner
Home Financials are based on the most recent Mortgage that was taken out on this home.
Original Mortgage
$202,350
Interest Rate
7.38%
Create a Home Valuation Report for This Property
The Home Valuation Report is an in-depth analysis detailing your home's value as well as a comparison with similar homes in the area
Home Values in the Area
Average Home Value in this Area
Purchase History
| Date | Buyer | Sale Price | Title Company |
|---|---|---|---|
| Kasala Naneth G | -- | American Title Co | |
| Ahad Rafiul | $266,000 | North American Title Co | |
| Wallace Earl Mark | $213,000 | Fidelity National Title Ins |
Source: Public Records
Mortgage History
| Date | Status | Borrower | Loan Amount |
|---|---|---|---|
| Open | Kasala Naneth G | $209,000 | |
| Closed | Ahad Rafiul | $212,800 | |
| Previous Owner | Wallace Earl Mark | $202,350 |
Source: Public Records
Tax History Compared to Growth
Tax History
| Year | Tax Paid | Tax Assessment Tax Assessment Total Assessment is a certain percentage of the fair market value that is determined by local assessors to be the total taxable value of land and additions on the property. | Land | Improvement |
|---|---|---|---|---|
| 2025 | $6,124 | $529,607 | $265,511 | $264,096 |
| 2024 | $6,124 | $519,223 | $260,305 | $258,918 |
| 2023 | $6,103 | $509,043 | $255,201 | $253,842 |
| 2022 | $6,079 | $499,063 | $250,198 | $248,865 |
| 2021 | $5,990 | $489,279 | $245,293 | $243,986 |
| 2020 | $5,885 | $484,263 | $242,778 | $241,485 |
| 2019 | $5,819 | $474,768 | $238,018 | $236,750 |
| 2018 | $5,529 | $465,459 | $233,351 | $232,108 |
| 2017 | $5,457 | $456,333 | $228,776 | $227,557 |
| 2016 | $5,234 | $447,387 | $224,291 | $223,096 |
| 2015 | $5,180 | $440,667 | $220,922 | $219,745 |
| 2014 | $5,034 | $432,036 | $216,595 | $215,441 |
Source: Public Records
Map
Nearby Homes
- 1476 San Benito Dr
- 49002 Cinnamon Fern Common Unit 311
- 49002 Cinnamon Fern Common Unit 430
- 145 Gamma Grass Terrace Unit U256
- 60 Wilson Way Unit 171
- 60 Wilson Way Unit 158
- 514 Bristle Grass Terrace
- 49199 Honeysuckle Terrace
- 1269 Knollview Dr
- 270 Tuolumne Dr
- 773 Heflin St
- 1109 El Camino Higuera
- 296 Kansas Way
- 1084 N Hillview Dr
- 392 Terra Mesa Way
- 99 Jacklin Ct
- 1000 Jacklin Rd
- 1566 Hidden Creek Ln
- 1610 Hidden Creek Ln
- 472 Mayten Way