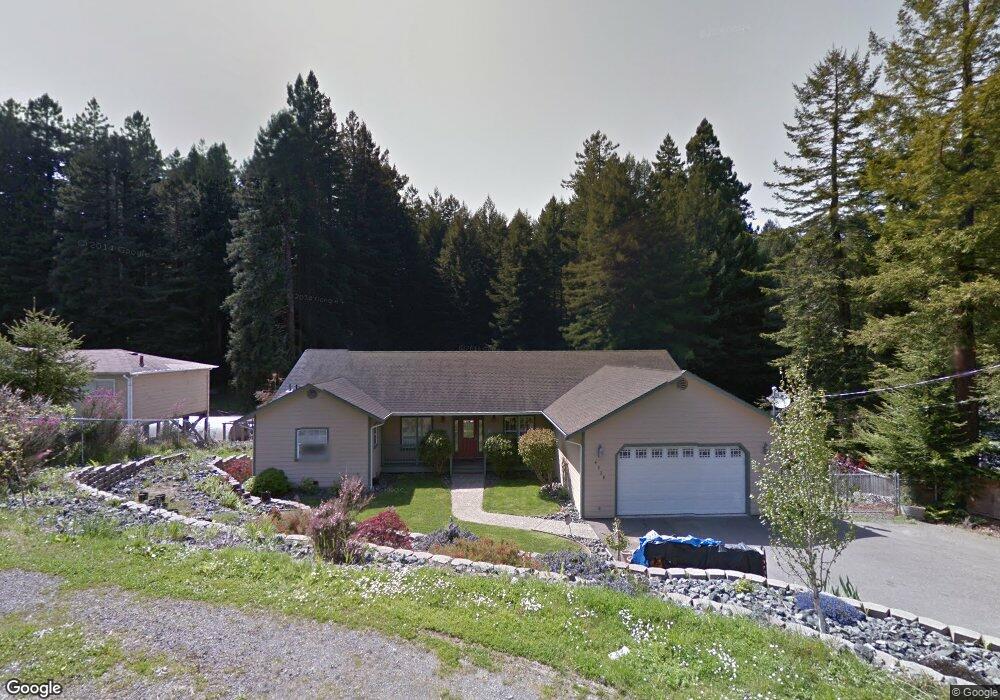
4228 Lentell Rd Eureka, CA 95503
Estimated Value: $838,000 - $1,007,000
About This Home
This home is located at 4228 Lentell Rd, Eureka, CA 95503 and is currently estimated at $937,476, approximately $253 per square foot. 4228 Lentell Rd is a home located in Humboldt County with nearby schools including Freshwater Elementary School, Mistwood Montessori School, and Gospel Outreach School.
Ownership History
We collect this data history from publicly available records. To have your information removed, we recommend requesting removal directly through your county’s website.
Purchase Details
Purchase Details
Home Financials for this Owner
Home Financials are based on the most recent Mortgage that was taken out on this home.Purchase Details
Purchase Details
Purchase History
We collect this data history from publicly available records. To have your information removed, we recommend requesting removal directly through your county’s website.
| Date | Buyer | Sale Price | Title Company |
|---|---|---|---|
| $50,000 | None Available | ||
| $605,000 | Humboldt Land Title Company | ||
| $302,000 | Humboldt Land & Title Co | ||
| $75,500 | Humboldt Land Title Company |
Mortgage History
We collect this data history from publicly available records. To have your information removed, we recommend requesting removal directly through your county’s website.
| Date | Status | Borrower | Loan Amount |
|---|---|---|---|
| Previous Owner | $484,000 |
Tax History
We collect this data history from publicly available records. To have your information removed, we recommend requesting removal directly through your county’s website.
| Year | Tax Paid | Tax Assessment Tax Assessment Total Assessment is a certain percentage of the fair market value that is determined by local assessors to be the total taxable value of land and additions on the property. | Land | Improvement |
|---|---|---|---|---|
| 2025 | $8,293 | $794,664 | $216,724 | $577,940 |
| 2024 | $8,293 | $779,083 | $212,475 | $566,608 |
| 2023 | $8,130 | $763,808 | $208,309 | $555,499 |
| 2022 | $8,436 | $748,832 | $204,225 | $544,607 |
| 2021 | $7,905 | $734,150 | $200,221 | $533,929 |
| 2020 | $7,847 | $726,623 | $198,168 | $528,455 |
| 2019 | $7,687 | $712,377 | $194,283 | $518,094 |
| 2018 | $7,573 | $698,410 | $190,474 | $507,936 |
| 2017 | $7,535 | $684,717 | $186,740 | $497,977 |
| 2016 | $7,537 | $671,292 | $183,079 | $488,213 |
| 2015 | $7,471 | $661,209 | $180,329 | $480,880 |
| 2014 | $6,989 | $648,258 | $176,797 | $471,461 |
Map
- 4281 Mitchell Rd
- 000 Mitchell Rd
- 130 Carlson Ln
- 3584 Mitchell Heights Dr
- 4928 Cummings Rd
- 2970 Pigeon Point Rd
- 2631 Hall Ave
- 3186 Lucia Ave
- 2470 Cypress Ave
- 3975 Cedar St
- 5423 Cummings Rd
- 4500 Cedar St
- 0 Woodland Way Unit 272082
- 3027 Brier Ln
- 2504 D St
- 2190 Foxwood Dr
- 2690 O'Neil Ln
- 2440 Harris St
- 5595 Cummings Rd
- 2005 Foxwood Dr
- 0 Lentell Rd
- 4208 Lentell Rd
- 4225 Lentell Rd
- 4186 Lentell Rd
- 4288 Lentell Rd
- 4185 Lentell Rd
- 4312 Lentell Rd
- 4336 Lentell Rd
- 4360 Lentell Rd
- 4184 Browns Rd
- 4220 Browns Rd
- 4409 Lentell Rd
- 4254 Browns Rd
- 4286 Browns Rd
- 4340 Browns Rd
- 4120 Mitchell Rd
- 4051 Lower Mitchell Rd
- 4000 Mitchell Rd
- 4145 Mitchell Rd
- 4145 Mitchell Rd
Ask me questions while you tour the home.