Estimated Value: $402,040 - $454,000
2
Beds
1
Bath
838
Sq Ft
$506/Sq Ft
Est. Value
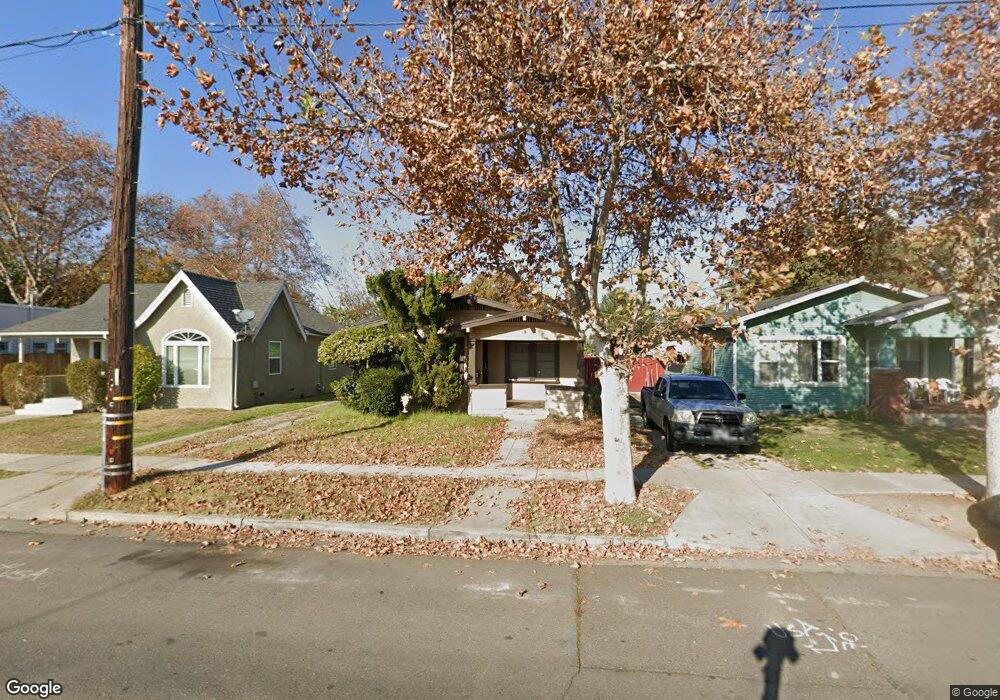
About This Home
This home is located at 427 W 10th St, Tracy, CA 95376 and is currently estimated at $424,260, approximately $506 per square foot. 427 W 10th St is a home located in San Joaquin County with nearby schools including South/West Park Elementary School, Monte Vista Middle School, and Tracy High School.
Ownership History
Date
Name
Owned For
Owner Type
Purchase Details
Closed on
Sep 25, 2019
Sold by
Ruppert Denise P and Ruppert Gregory W
Bought by
Dpr Grant Line Llc
Current Estimated Value
Purchase Details
Closed on
Jul 31, 2003
Sold by
Ruppert Gregory W and Ruppert Denise P
Bought by
Rupper Gregory W and Ruppert Denise P
Home Financials for this Owner
Home Financials are based on the most recent Mortgage that was taken out on this home.
Original Mortgage
$154,000
Interest Rate
4.44%
Mortgage Type
Negative Amortization
Purchase Details
Closed on
Nov 26, 2001
Sold by
Elliott Margaret M
Bought by
Ruppert Greg and Ruppert Denise
Home Financials for this Owner
Home Financials are based on the most recent Mortgage that was taken out on this home.
Original Mortgage
$152,800
Interest Rate
6.67%
Create a Home Valuation Report for This Property
The Home Valuation Report is an in-depth analysis detailing your home's value as well as a comparison with similar homes in the area
Home Values in the Area
Average Home Value in this Area
Purchase History
| Date | Buyer | Sale Price | Title Company |
|---|---|---|---|
| Dpr Grant Line Llc | -- | None Available | |
| Rupper Gregory W | -- | Fidelity Natl Title Ins Co | |
| Ruppert Greg | $191,000 | Fidelity National Title Co |
Source: Public Records
Mortgage History
| Date | Status | Borrower | Loan Amount |
|---|---|---|---|
| Previous Owner | Rupper Gregory W | $154,000 | |
| Previous Owner | Ruppert Greg | $152,800 |
Source: Public Records
Tax History
| Year | Tax Paid | Tax Assessment Tax Assessment Total Assessment is a certain percentage of the fair market value that is determined by local assessors to be the total taxable value of land and additions on the property. | Land | Improvement |
|---|---|---|---|---|
| 2025 | $3,259 | $282,146 | $84,198 | $197,948 |
| 2024 | $3,003 | $276,615 | $82,548 | $194,067 |
| 2023 | $2,956 | $271,192 | $80,930 | $190,262 |
| 2022 | $2,896 | $265,876 | $79,344 | $186,532 |
| 2021 | $2,862 | $260,664 | $77,789 | $182,875 |
| 2020 | $2,844 | $257,992 | $76,992 | $181,000 |
| 2019 | $2,799 | $252,934 | $75,483 | $177,451 |
| 2018 | $2,753 | $247,975 | $74,003 | $173,972 |
| 2017 | $2,615 | $243,113 | $72,552 | $170,561 |
| 2016 | $2,647 | $238,347 | $71,130 | $167,217 |
| 2015 | $2,004 | $179,000 | $53,000 | $126,000 |
| 2014 | $1,379 | $127,600 | $38,500 | $89,100 |
Source: Public Records
Map
Nearby Homes
- 920 Taft Ave
- 1241 Parker Ave Unit 1
- 1243 Parker Ave Unit 2
- 214 W 7th St
- 206 W 12th St
- 1245 Parker Ave Unit 3
- 18 W 8th St
- 1434 Parker Ave
- 389 Burlington Dr
- 54 E 8th St
- 143 W Beverly Place
- 345 W Carlton Way
- 1636 Parker Ave
- 213 W South St
- 262 W Lowell Ave
- 445 W Lowell Ave
- 1495 Mae Ave
- 535 W Lowell Ave
- 1416 Audrey Dr
- 539 W Lowell Ave
- 435 W 10th St
- 419 W 10th St
- 1026 Windeler Ave Unit B
- 1026 Windeler Ave
- 415 W 10th St
- 441 W 10th St
- 403 W 10th St
- 375 W 10th St
- 401 W 10th St
- 424 W 10th St
- 434 W 10th St
- 414 W 10th St
- 1005 Windeler Ave
- 1017 Windeler Ave
- 404 W 10th St
- 950 Windeler Ave
- 1025 Windeler Ave
- 1011 Windeler Ave
- 400 W 10th St
- 1029 Windeler Ave
Your Personal Tour Guide
Ask me questions while you tour the home.