Estimated Value: $333,000 - $427,000
1
Bed
1
Bath
733
Sq Ft
$523/Sq Ft
Est. Value
About This Home
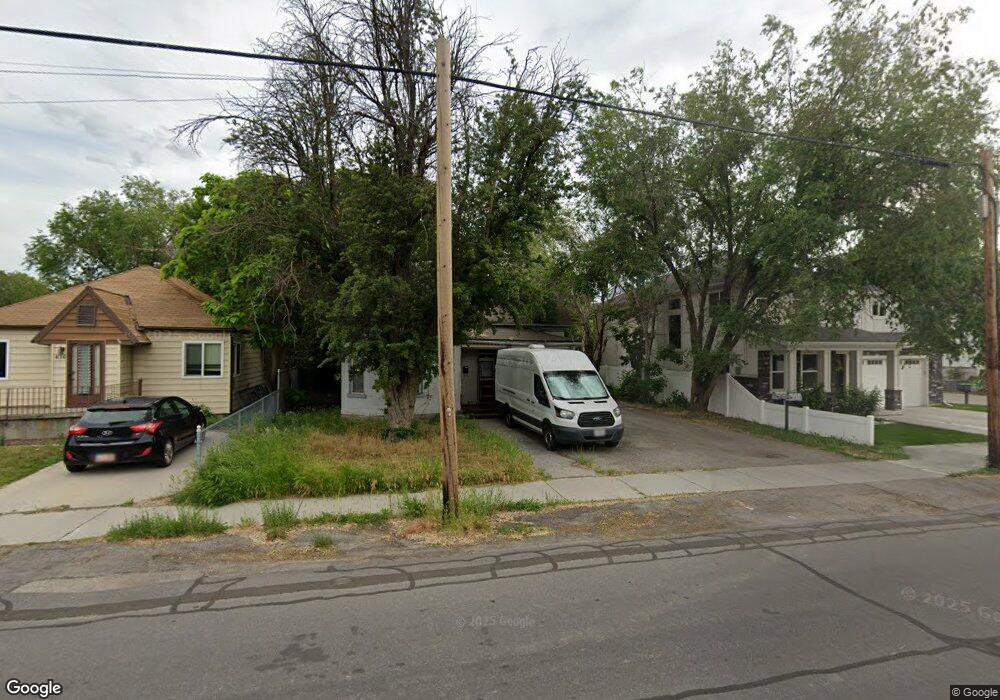
This home is located at 428 E 8800 S, Sandy, UT 84070 and is currently estimated at $383,144, approximately $522 per square foot. 428 E 8800 S is a home located in Salt Lake County with nearby schools including Sandy Elementary School, Mount Jordan Middle School, and Jordan High.
Ownership History
Date
Name
Owned For
Owner Type
Purchase Details
Closed on
Sep 12, 2024
Sold by
Chiaramonte Steven C
Bought by
Steven C Chiaramonte Living Trust and Chiaramonte
Current Estimated Value
Purchase Details
Closed on
Dec 29, 2008
Sold by
Chiaramonte Steven C
Bought by
Chiaramonte Steven C and Chiaramonte Jody
Purchase Details
Closed on
Nov 28, 1994
Sold by
Derricott Don R and Derricott Carolyn
Bought by
Chiaramonte Steven C
Home Financials for this Owner
Home Financials are based on the most recent Mortgage that was taken out on this home.
Original Mortgage
$42,500
Interest Rate
8.92%
Mortgage Type
Seller Take Back
Create a Home Valuation Report for This Property
The Home Valuation Report is an in-depth analysis detailing your home's value as well as a comparison with similar homes in the area
Home Values in the Area
Average Home Value in this Area
Purchase History
| Date | Buyer | Sale Price | Title Company |
|---|---|---|---|
| Steven C Chiaramonte Living Trust | -- | None Listed On Document | |
| Chiaramonte Steven C | -- | None Available | |
| Chiaramonte Steven C | -- | -- |
Source: Public Records
Mortgage History
| Date | Status | Borrower | Loan Amount |
|---|---|---|---|
| Previous Owner | Chiaramonte Steven C | $42,500 |
Source: Public Records
Tax History
| Year | Tax Paid | Tax Assessment Tax Assessment Total Assessment is a certain percentage of the fair market value that is determined by local assessors to be the total taxable value of land and additions on the property. | Land | Improvement |
|---|---|---|---|---|
| 2025 | $1,501 | $346,800 | $137,100 | $209,700 |
| 2024 | $1,501 | $277,600 | $125,700 | $151,900 |
| 2023 | $1,501 | $252,600 | $119,500 | $133,100 |
| 2022 | $1,522 | $274,200 | $117,200 | $157,000 |
| 2021 | $1,444 | $221,500 | $91,700 | $129,800 |
| 2020 | $1,363 | $197,100 | $91,700 | $105,400 |
| 2019 | $1,210 | $170,500 | $87,100 | $83,400 |
| 2018 | $1,045 | $153,300 | $67,800 | $85,500 |
| 2017 | $1,002 | $140,400 | $62,700 | $77,700 |
| 2016 | $1,054 | $142,800 | $62,700 | $80,100 |
| 2015 | $1,099 | $137,800 | $64,000 | $73,800 |
| 2014 | $1,101 | $135,300 | $65,400 | $69,900 |
Source: Public Records
Map
Nearby Homes
- 412 E 8760 S
- 270 E 8680 S
- 8732 S 620 E
- 8558 S Center St
- 220 E Pioneer Ave
- 362 E 9150 S
- 8729 S Leafwood Ln
- 8459 S 300 E
- 194 Pioneer Ave
- 8797 Green Way Unit 3
- 112 E 8680 S
- 8722 S Oakwood Park Cir
- 8732 S Oakwood Park Cr
- 227 E St Germain Way
- 149 E Pioneer Ave
- 359 E 8400 S
- 181 E 9180 S
- 487 E 9270 S
- 87 Pioneer Ave
- 566 E 9270 S
Your Personal Tour Guide
Ask me questions while you tour the home.