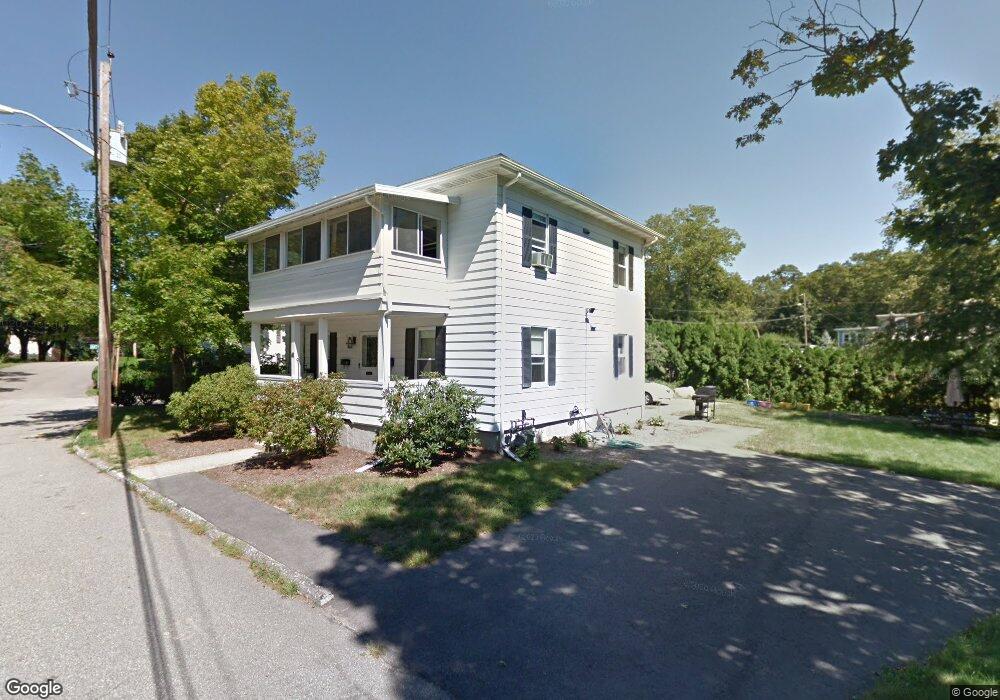
43 Moore Ave Franklin, MA 02038
Downtown Franklin NeighborhoodEstimated Value: $540,000 - $640,000
4
Beds
2
Baths
1,560
Sq Ft
$365/Sq Ft
Est. Value
About This Home
This home is located at 43 Moore Ave, Franklin, MA 02038 and is currently estimated at $569,428, approximately $365 per square foot. 43 Moore Ave is a home located in Norfolk County with nearby schools including Oak Street Elementary School, Horace Mann Middle School, and Franklin High School.
Ownership History
Date
Name
Owned For
Owner Type
Purchase Details
Closed on
Nov 15, 2017
Sold by
Falcone Michael J
Bought by
Falcone Michael J and Falcone Lauren
Current Estimated Value
Purchase Details
Closed on
Feb 14, 2011
Sold by
Loporto Lawrence M
Bought by
Falcone Michael J
Home Financials for this Owner
Home Financials are based on the most recent Mortgage that was taken out on this home.
Original Mortgage
$265,591
Interest Rate
5.5%
Mortgage Type
FHA
Create a Home Valuation Report for This Property
The Home Valuation Report is an in-depth analysis detailing your home's value as well as a comparison with similar homes in the area
Home Values in the Area
Average Home Value in this Area
Purchase History
| Date | Buyer | Sale Price | Title Company |
|---|---|---|---|
| Falcone Michael J | -- | -- | |
| Falcone Michael J | $272,500 | -- |
Source: Public Records
Mortgage History
| Date | Status | Borrower | Loan Amount |
|---|---|---|---|
| Previous Owner | Falcone Michael J | $265,591 |
Source: Public Records
Tax History
| Year | Tax Paid | Tax Assessment Tax Assessment Total Assessment is a certain percentage of the fair market value that is determined by local assessors to be the total taxable value of land and additions on the property. | Land | Improvement |
|---|---|---|---|---|
| 2025 | $6,045 | $520,200 | $220,300 | $299,900 |
| 2024 | $5,498 | $466,300 | $220,300 | $246,000 |
| 2023 | $5,084 | $404,100 | $203,800 | $200,300 |
| 2022 | $4,690 | $333,800 | $183,600 | $150,200 |
| 2021 | $4,542 | $310,000 | $172,300 | $137,700 |
| 2020 | $4,679 | $322,500 | $198,800 | $123,700 |
| 2019 | $4,147 | $282,900 | $169,000 | $113,900 |
| 2018 | $3,837 | $261,900 | $175,600 | $86,300 |
| 2017 | $3,814 | $261,600 | $165,700 | $95,900 |
| 2016 | $3,798 | $261,900 | $178,900 | $83,000 |
| 2015 | $3,443 | $232,000 | $154,300 | $77,700 |
| 2014 | $2,997 | $207,400 | $129,700 | $77,700 |
Source: Public Records
Map
Nearby Homes
- 17 Longhill Rd
- 14 Pleasant St Unit B
- 88 Crescent St
- 70 Oak St
- 204 Lincoln St
- 120 Union St Unit 1
- 30 Longobardi Dr Unit 30
- 90 E Central St Unit 103
- 90 E Central St Unit 106
- 90 E Central St Unit 304
- 90 E Central St Unit 202
- 90 E Central St Unit 105
- 90 E Central St Unit 301
- 99 Summer St
- 78 Highwood Dr
- 62 Uncas Ave
- 64 Uncas Ave
- 76 Uncas Ave
- 66 Uncas Ave
- 68 Uncas Ave
- 35 Moore Ave
- 35 Moore Ave Unit 1
- 37 Moore Ave Unit 1
- 37 Moore Ave
- 35-37 Moore Ave Unit 37
- 35-37 Moore Ave
- 13 Anthony St
- 2 Pinehurst St
- 33 Moore Ave
- 6 Pinehurst St
- 10 Anthony St
- 29 Moore Ave
- 32 Moore Ave
- 32-34 Moore Ave Unit 2
- 32 Moore Ave Unit 2
- 34 Moore Ave Unit 2nd flr
- 34 Moore Ave
- 34 Moore Ave Unit 34
- 40 Moore Ave
- 57 Moore Ave
Your Personal Tour Guide
Ask me questions while you tour the home.