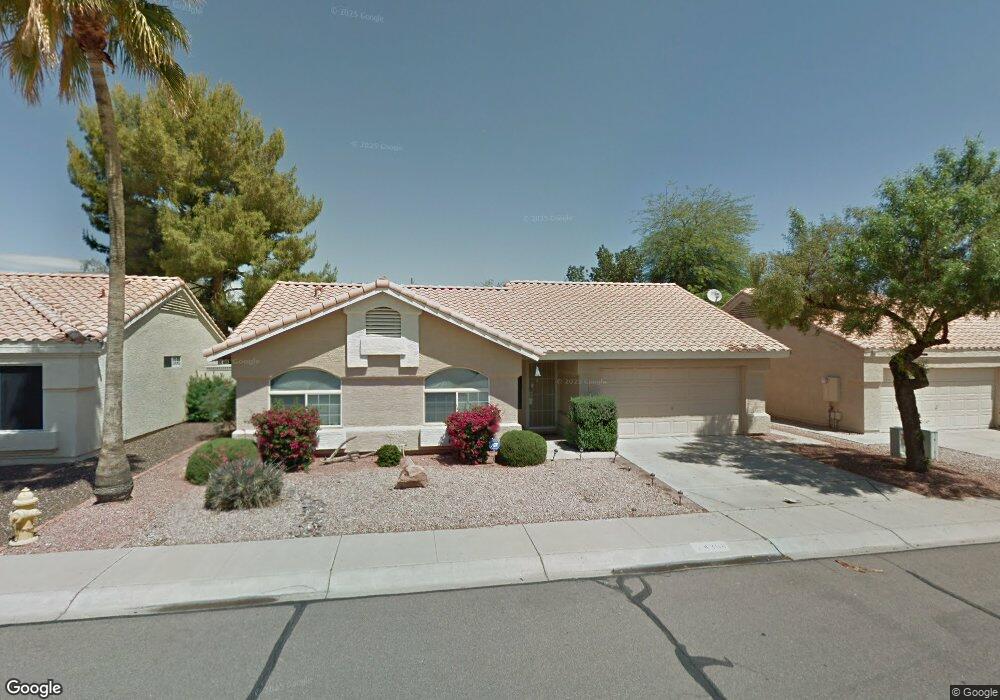
4308 E Windmere Dr Phoenix, AZ 85048
Ahwatukee NeighborhoodEstimated Value: $388,034 - $435,000
3
Beds
2
Baths
1,352
Sq Ft
$309/Sq Ft
Est. Value
About This Home
This home is located at 4308 E Windmere Dr, Phoenix, AZ 85048 and is currently estimated at $418,009, approximately $309 per square foot. 4308 E Windmere Dr is a home located in Maricopa County with nearby schools including Kyrene del Milenio, Kyrene Akimel A-al Middle School, and Desert Vista High School.
Ownership History
Date
Name
Owned For
Owner Type
Purchase Details
Closed on
Jul 31, 2009
Sold by
Federal Home Loan Mortgage Corporation
Bought by
Hackman Aimee
Current Estimated Value
Home Financials for this Owner
Home Financials are based on the most recent Mortgage that was taken out on this home.
Original Mortgage
$94,000
Outstanding Balance
$60,912
Interest Rate
5.09%
Mortgage Type
New Conventional
Estimated Equity
$357,097
Purchase Details
Closed on
Jan 11, 2006
Sold by
Baker Bradley
Bought by
Jordan Charleston L and Jordan Lorraine
Home Financials for this Owner
Home Financials are based on the most recent Mortgage that was taken out on this home.
Original Mortgage
$220,000
Interest Rate
6.37%
Mortgage Type
Purchase Money Mortgage
Purchase Details
Closed on
Aug 9, 1994
Sold by
Huerbsch Richard A and Huerbsch Kim
Bought by
Baker Bradley Odell and Baker Janetta Lee
Home Financials for this Owner
Home Financials are based on the most recent Mortgage that was taken out on this home.
Original Mortgage
$88,500
Interest Rate
4.62%
Mortgage Type
New Conventional
Create a Home Valuation Report for This Property
The Home Valuation Report is an in-depth analysis detailing your home's value as well as a comparison with similar homes in the area
Home Values in the Area
Average Home Value in this Area
Purchase History
| Date | Buyer | Sale Price | Title Company |
|---|---|---|---|
| Hackman Aimee | $161,900 | First American Title Ins Co | |
| Jordan Charleston L | $275,000 | Title Security Agency Of Az | |
| Baker Bradley Odell | $98,500 | Chicago Title Insurance Co |
Source: Public Records
Mortgage History
| Date | Status | Borrower | Loan Amount |
|---|---|---|---|
| Open | Hackman Aimee | $94,000 | |
| Previous Owner | Jordan Charleston L | $220,000 | |
| Previous Owner | Baker Bradley Odell | $88,500 | |
| Closed | Jordan Charleston L | $41,250 |
Source: Public Records
Tax History
| Year | Tax Paid | Tax Assessment Tax Assessment Total Assessment is a certain percentage of the fair market value that is determined by local assessors to be the total taxable value of land and additions on the property. | Land | Improvement |
|---|---|---|---|---|
| 2025 | $1,960 | $21,862 | -- | -- |
| 2024 | $1,865 | $20,821 | -- | -- |
| 2023 | $1,865 | $30,570 | $6,110 | $24,460 |
| 2022 | $1,776 | $23,350 | $4,670 | $18,680 |
| 2021 | $1,853 | $21,530 | $4,300 | $17,230 |
| 2020 | $1,807 | $20,760 | $4,150 | $16,610 |
| 2019 | $1,749 | $19,100 | $3,820 | $15,280 |
| 2018 | $1,689 | $17,570 | $3,510 | $14,060 |
| 2017 | $1,612 | $16,980 | $3,390 | $13,590 |
| 2016 | $1,634 | $16,630 | $3,320 | $13,310 |
| 2015 | $1,463 | $14,880 | $2,970 | $11,910 |
Source: Public Records
Map
Nearby Homes
- 4251 E South Fork Dr
- 4114 E Muirwood Dr
- 4130 E Mountain Vista Dr
- 4122 E Mountain Vista Dr
- 4425 E Mountain Sky Ave
- 15235 S 44th Place
- 4309 E Tanglewood Dr
- 15034 S 44th Place
- 4534 E Amberwood Dr
- 4430 E Cathedral Rock Dr
- 16515 S 40th St Unit 131
- 15022 S 46th Place
- 4309 E Thistle Landing Dr
- 4439 E Thistle Landing Dr
- 4402 E Glenhaven Dr
- 3830 E Lakewood Pkwy E Unit 3014
- 3830 E Lakewood Pkwy E Unit 2162
- 3830 E Lakewood Pkwy E Unit 1038
- 3830 E Lakewood Pkwy E Unit 3079
- 3830 E Lakewood Pkwy E Unit 2047
- 4314 E Windmere Dr
- 4302 E Windmere Dr
- 4320 E Windmere Dr
- 4232 E Windmere Dr
- 4309 E Windmere Dr
- 4303 E Windmere Dr
- 4235 E Windmere Dr
- 4326 E Windmere Dr
- 4226 E Windmere Dr
- 15637 S 43rd Place
- 15644 S 43rd Place
- 4231 E Windmere Dr
- 4242 E Brookwood Ct
- 15643 S 43rd Place
- 4330 E Windmere Dr
- 4220 E Windmere Dr Unit *SUPER
- 4220 E Windmere Dr
- 15634 S 43rd Way
- 15634 S 43rd Place
- 15650 S 43rd Place
Your Personal Tour Guide
Ask me questions while you tour the home.