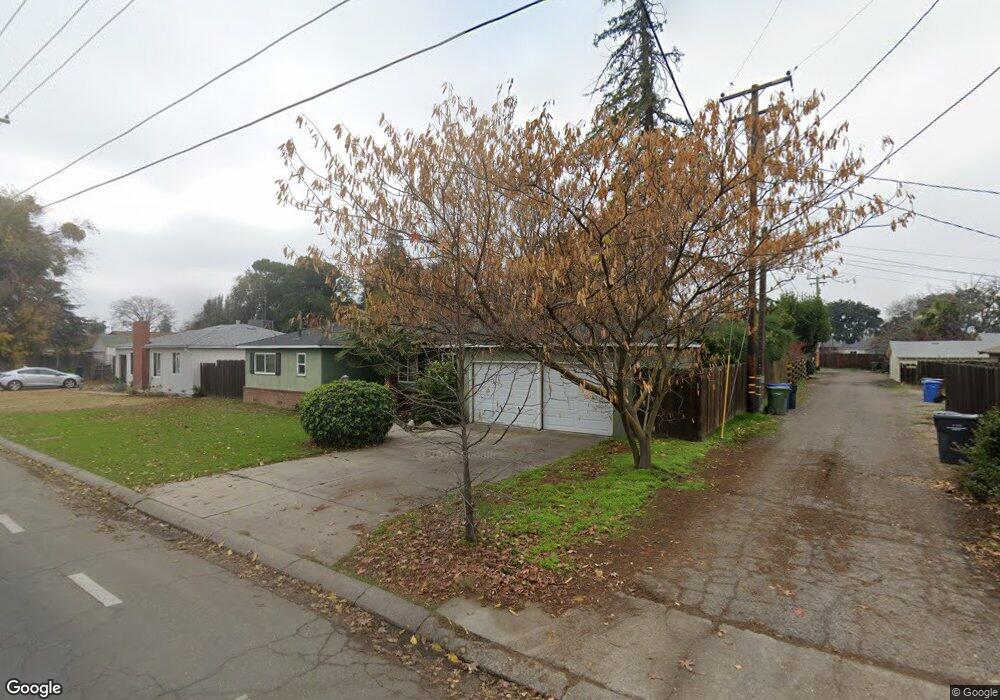
431 N Johnson Rd Turlock, CA 95380
Estimated Value: $369,384 - $436,000
3
Beds
2
Baths
1,265
Sq Ft
$327/Sq Ft
Est. Value
About This Home
This home is located at 431 N Johnson Rd, Turlock, CA 95380 and is currently estimated at $413,596, approximately $326 per square foot. 431 N Johnson Rd is a home located in Stanislaus County with nearby schools including Julien Elementary School, Marvin A. Dutcher Middle School, and Turlock Junior High School.
Ownership History
Date
Name
Owned For
Owner Type
Purchase Details
Closed on
Jan 4, 2016
Sold by
Sanders Sliger Janice M and The Janice Sanders Sliger 2007
Bought by
Sanders Sliger Janice M and The Janice Sanders Sliger 2007
Current Estimated Value
Home Financials for this Owner
Home Financials are based on the most recent Mortgage that was taken out on this home.
Original Mortgage
$105,000
Interest Rate
3.94%
Mortgage Type
Purchase Money Mortgage
Purchase Details
Closed on
Sep 5, 2014
Sold by
Steeley Randall H
Bought by
Revocab Steeley Randall H and Revocab Randall H Steeley 2014
Purchase Details
Closed on
Jul 26, 2007
Sold by
Sanders Sliger Janice M
Bought by
Sanders Sliger Janice M and Janice Sanders Sliger 2007 Tru
Purchase Details
Closed on
Jun 28, 2007
Sold by
Sanders Sliger Janice M and Steeley Randy H
Bought by
Sanders Sliger Janice M and Steeley Randy H
Purchase Details
Closed on
Dec 29, 2004
Sold by
Steeley Ormel Howard and Steeley Family Trust
Bought by
Sanders Sliger Janice M and Steeley Randy H
Purchase Details
Closed on
Jun 20, 1995
Sold by
Steeley Ormel H and Steeley Mildred F
Bought by
Steeley Ormel Howard
Create a Home Valuation Report for This Property
The Home Valuation Report is an in-depth analysis detailing your home's value as well as a comparison with similar homes in the area
Purchase History
| Date | Buyer | Sale Price | Title Company |
|---|---|---|---|
| Sanders Sliger Janice M | $75,000 | Placer Title Company | |
| Revocab Steeley Randall H | -- | None Available | |
| Sanders Sliger Janice M | -- | None Available | |
| Sanders Sliger Janice M | -- | None Available | |
| Sanders Sliger Janice M | -- | -- | |
| Steeley Ormel Howard | -- | -- |
Source: Public Records
Mortgage History
| Date | Status | Borrower | Loan Amount |
|---|---|---|---|
| Closed | Sanders Sliger Janice M | $105,000 |
Source: Public Records
Tax History
| Year | Tax Paid | Tax Assessment Tax Assessment Total Assessment is a certain percentage of the fair market value that is determined by local assessors to be the total taxable value of land and additions on the property. | Land | Improvement |
|---|---|---|---|---|
| 2025 | $1,724 | $160,425 | $70,893 | $89,532 |
| 2024 | $1,692 | $157,280 | $69,503 | $87,777 |
| 2023 | $1,689 | $154,197 | $68,141 | $86,056 |
| 2022 | $1,668 | $151,174 | $66,805 | $84,369 |
| 2021 | $1,643 | $148,211 | $65,496 | $82,715 |
| 2020 | $1,632 | $146,692 | $64,825 | $81,867 |
| 2019 | $1,605 | $143,816 | $63,554 | $80,262 |
| 2018 | $1,603 | $140,997 | $62,308 | $78,689 |
| 2017 | $1,566 | $138,234 | $61,087 | $77,147 |
| 2016 | $554 | $51,010 | $11,760 | $39,250 |
| 2015 | $548 | $50,245 | $11,584 | $38,661 |
| 2014 | $543 | $49,262 | $11,358 | $37,904 |
Source: Public Records
Map
Nearby Homes
- 1550 E Marshall St
- 1438 Cahill Ave
- 2521 East Ave
- 2355 El Capitan Dr
- 1598 East Ave
- 2500 Mira Flores Dr
- 401 Bothun Rd
- 411 Bothun Rd
- 716 N Daubenberger Rd
- 1425 Forest Dr
- 951 E Main St
- 1109 Alpha Rd
- 1030 Alpha Rd
- 1460 E Hawkeye Ave
- 599 S Minaret Ave
- 1701 Sylvia Ct
- 1730 Sylvia Ct
- 528 S Minaret Ave
- 861 Wayside Dr
- 1820 N Berkeley Ave
- 401 N Johnson Rd
- 1945 E Marshall St
- 1998 Charles Place
- 1980 Charles Place
- 2000 Zinfandel Ln
- 1943 E Marshall St
- 1930 Charles Place
- 2020 Zinfandel Ln
- 2025 E Marshall St
- 1960 E Marshall St
- 2005 Zinfandel Ln
- 1895 E Marshall St
- 1900 Charles Place
- 2040 Zinfandel Ln
- 2045 E Marshall St
- 2025 Zinfandel Ln
- 1920 E Marshall St
- 1995 Charles Place
- 1975 Charles Place
- 1876 Charles Place
Your Personal Tour Guide
Ask me questions while you tour the home.