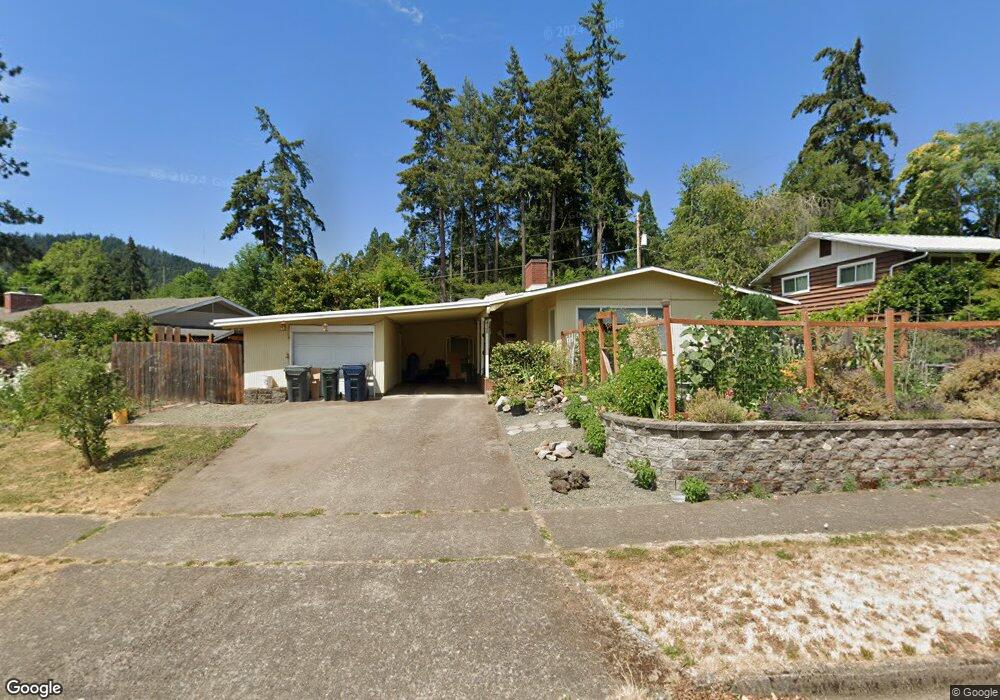
4320 High St Eugene, OR 97405
Southeast Eugene NeighborhoodEstimated Value: $470,543 - $485,000
3
Beds
2
Baths
1,504
Sq Ft
$319/Sq Ft
Est. Value
About This Home
This home is located at 4320 High St, Eugene, OR 97405 and is currently estimated at $479,886, approximately $319 per square foot. 4320 High St is a home located in Lane County with nearby schools including Edgewood Community Elementary School, Spencer Butte Middle School, and South Eugene High School.
Ownership History
Date
Name
Owned For
Owner Type
Purchase Details
Closed on
Aug 10, 2020
Sold by
Cook Matt and Mcharry Annee
Bought by
Cook Matt and Cook Annee
Current Estimated Value
Home Financials for this Owner
Home Financials are based on the most recent Mortgage that was taken out on this home.
Original Mortgage
$226,300
Outstanding Balance
$179,331
Interest Rate
3%
Mortgage Type
New Conventional
Estimated Equity
$300,555
Purchase Details
Closed on
Nov 13, 2015
Sold by
Jensen Kathleen A
Bought by
Cook Matt and Mcharry Annee
Home Financials for this Owner
Home Financials are based on the most recent Mortgage that was taken out on this home.
Original Mortgage
$237,500
Interest Rate
3.71%
Mortgage Type
New Conventional
Purchase Details
Closed on
Aug 23, 2012
Sold by
Mckay Patricia A
Bought by
Jensen Kathleen A
Purchase Details
Closed on
Dec 17, 2004
Sold by
Thompson G Bill and Thompson Maxine A
Bought by
Mckay Robert C and Mckay Patricia A
Create a Home Valuation Report for This Property
The Home Valuation Report is an in-depth analysis detailing your home's value as well as a comparison with similar homes in the area
Home Values in the Area
Average Home Value in this Area
Purchase History
| Date | Buyer | Sale Price | Title Company |
|---|---|---|---|
| Cook Matt | -- | Cascade Title Co | |
| Cook Matt | $250,000 | Cal Sierra Title | |
| Jensen Kathleen A | $242,500 | Multiple | |
| Mckay Robert C | $167,500 | Western Title & Escrow Co |
Source: Public Records
Mortgage History
| Date | Status | Borrower | Loan Amount |
|---|---|---|---|
| Open | Cook Matt | $226,300 | |
| Closed | Cook Matt | $237,500 |
Source: Public Records
Tax History
| Year | Tax Paid | Tax Assessment Tax Assessment Total Assessment is a certain percentage of the fair market value that is determined by local assessors to be the total taxable value of land and additions on the property. | Land | Improvement |
|---|---|---|---|---|
| 2025 | $4,836 | $248,189 | -- | -- |
| 2024 | $4,776 | $240,961 | -- | -- |
| 2023 | $4,776 | $233,943 | $0 | $0 |
| 2022 | $4,474 | $227,130 | $0 | $0 |
| 2021 | $4,202 | $220,515 | $0 | $0 |
| 2020 | $4,217 | $214,093 | $0 | $0 |
| 2019 | $4,073 | $207,858 | $0 | $0 |
| 2018 | $3,834 | $195,926 | $0 | $0 |
| 2017 | $3,634 | $195,926 | $0 | $0 |
| 2016 | $3,473 | $190,219 | $0 | $0 |
| 2015 | $3,345 | $184,679 | $0 | $0 |
| 2014 | $3,265 | $179,300 | $0 | $0 |
Source: Public Records
Map
Nearby Homes
- 4295 Ferry St
- 170 E 40th Ave
- 4023 Donald St Unit K
- 17 Westbrook Way
- 21 Westbrook Way
- 36 Westbrook Way
- 4734 Brookwood St
- 434 E 39th Ave
- 4425 Hilyard St
- 4845 Brookwood St
- 275 E 39th Ave
- 0 E 39th Ave
- 278 Rockridge Ct
- 4364 Fox Hollow Rd
- 4320 Fox Hollow Rd
- 126 Treehill Loop Unit 126
- 910 E 43rd Ave
- 143 Treehill Loop Unit 143
- 320 Dellwood Dr
- 4429 Fox Hollow Rd Unit 3
Your Personal Tour Guide
Ask me questions while you tour the home.