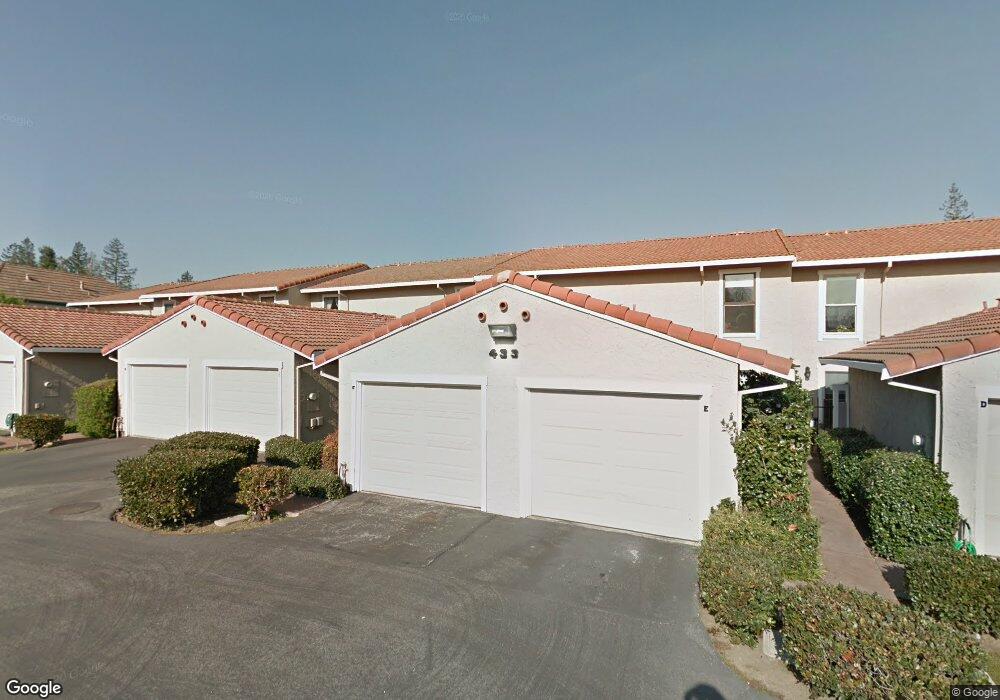
433 W Rincon Ave Unit G Campbell, CA 95008
Downtown Campbell NeighborhoodEstimated Value: $908,672 - $1,097,000
2
Beds
2
Baths
1,134
Sq Ft
$880/Sq Ft
Est. Value
About This Home
This home is located at 433 W Rincon Ave Unit G, Campbell, CA 95008 and is currently estimated at $997,668, approximately $879 per square foot. 433 W Rincon Ave Unit G is a home located in Santa Clara County with nearby schools including Westmont High School, Campbell School of Innovation, and Capri Elementary.
Ownership History
Date
Name
Owned For
Owner Type
Purchase Details
Closed on
Jul 10, 2012
Sold by
Liao Chen Kuo Hsiung and Liao Chen Ling Mei
Bought by
Liao Chen Kuo Hsiung and Liao Chen Ling Mei
Current Estimated Value
Purchase Details
Closed on
May 25, 2012
Sold by
Michelmore Christina L and Michelmore John C
Bought by
Chen Kuo Hsiung
Purchase Details
Closed on
Jun 12, 2007
Sold by
Witter Eric P and Witter Carol Lee
Bought by
Michelmore Christina L and Michelmore John C
Home Financials for this Owner
Home Financials are based on the most recent Mortgage that was taken out on this home.
Original Mortgage
$378,750
Interest Rate
6.62%
Mortgage Type
Purchase Money Mortgage
Purchase Details
Closed on
Dec 23, 2004
Sold by
Witter Eric P and Witter Carol Lee
Bought by
Witter Eric P and Witter Carol Lee
Home Financials for this Owner
Home Financials are based on the most recent Mortgage that was taken out on this home.
Original Mortgage
$343,000
Interest Rate
4.87%
Mortgage Type
Stand Alone Refi Refinance Of Original Loan
Purchase Details
Closed on
Jul 1, 2003
Sold by
Nguyen Tuyen and Nguyen Nhung
Bought by
Witter Eric and Perkins Carol
Home Financials for this Owner
Home Financials are based on the most recent Mortgage that was taken out on this home.
Original Mortgage
$301,560
Interest Rate
3.75%
Mortgage Type
Purchase Money Mortgage
Purchase Details
Closed on
Feb 14, 2003
Sold by
Nguyen Nhung and Nguyen Tuyen
Bought by
Nguyen Tuyen and Nguyen Nhung
Home Financials for this Owner
Home Financials are based on the most recent Mortgage that was taken out on this home.
Original Mortgage
$200,000
Interest Rate
5.16%
Mortgage Type
Purchase Money Mortgage
Purchase Details
Closed on
Feb 5, 2003
Sold by
Nguyen Tuyen and Nguyen Nhung
Bought by
Nguyen Tuyen and Nguyen Nhung
Home Financials for this Owner
Home Financials are based on the most recent Mortgage that was taken out on this home.
Original Mortgage
$200,000
Interest Rate
5.16%
Mortgage Type
Purchase Money Mortgage
Purchase Details
Closed on
May 21, 2001
Sold by
Nguyen Tuyen and Nguyen Nhung
Bought by
Nguyen Tuyen and Nguyen Nhung
Purchase Details
Closed on
Jun 10, 1994
Sold by
Roy Kathleen B
Bought by
Nguyen Tuyen and Nguyen Nhung
Home Financials for this Owner
Home Financials are based on the most recent Mortgage that was taken out on this home.
Original Mortgage
$150,300
Interest Rate
8.56%
Mortgage Type
Purchase Money Mortgage
Create a Home Valuation Report for This Property
The Home Valuation Report is an in-depth analysis detailing your home's value as well as a comparison with similar homes in the area
Home Values in the Area
Average Home Value in this Area
Purchase History
| Date | Buyer | Sale Price | Title Company |
|---|---|---|---|
| Liao Chen Kuo Hsiung | -- | None Available | |
| Chen Kuo Hsiung | $342,000 | Chicago Title Company | |
| Michelmore Christina L | $505,000 | Stewart Title Of Ca Inc | |
| Witter Eric P | -- | Chicago Title | |
| Witter Eric | $377,000 | Alliance Title Company | |
| Nguyen Tuyen | -- | Alliance Title Company | |
| Nguyen Tuyen | -- | Alliance Title Company | |
| Nguyen Tuyen | -- | -- | |
| Nguyen Tuyen | $167,000 | Old Republic Title Company |
Source: Public Records
Mortgage History
| Date | Status | Borrower | Loan Amount |
|---|---|---|---|
| Previous Owner | Michelmore Christina L | $378,750 | |
| Previous Owner | Witter Eric P | $343,000 | |
| Previous Owner | Witter Eric | $301,560 | |
| Previous Owner | Nguyen Tuyen | $200,000 | |
| Previous Owner | Nguyen Tuyen | $150,300 | |
| Closed | Witter Eric | $37,650 |
Source: Public Records
Tax History Compared to Growth
Tax History
| Year | Tax Paid | Tax Assessment Tax Assessment Total Assessment is a certain percentage of the fair market value that is determined by local assessors to be the total taxable value of land and additions on the property. | Land | Improvement |
|---|---|---|---|---|
| 2025 | $5,916 | $429,559 | $322,173 | $107,386 |
| 2024 | $5,916 | $421,137 | $315,856 | $105,281 |
| 2023 | $5,840 | $412,880 | $309,663 | $103,217 |
| 2022 | $5,841 | $404,786 | $303,592 | $101,194 |
| 2021 | $5,721 | $396,850 | $297,640 | $99,210 |
| 2020 | $5,563 | $392,782 | $294,589 | $98,193 |
| 2019 | $5,471 | $385,081 | $288,813 | $96,268 |
| 2018 | $5,296 | $377,531 | $283,150 | $94,381 |
| 2017 | $5,208 | $370,130 | $277,599 | $92,531 |
| 2016 | $4,890 | $362,873 | $272,156 | $90,717 |
| 2015 | $4,799 | $357,423 | $268,068 | $89,355 |
| 2014 | $4,584 | $350,422 | $262,817 | $87,605 |
Source: Public Records
Map
Nearby Homes
- 433 W Rincon Ave Unit H
- 253 W Rincon Ave
- 188 W Rincon Ave
- 341 Carlyn Ave
- 203 Wilton Dr
- 385 Lawndale Ave
- 63 Braxton Terrace
- 440 N Milton Ave
- 3820 Ainsley Ct
- 411 Dunster Dr
- 408 Darryl Dr
- 21 N 2nd St Unit 306
- 21 N 2nd St Unit 303
- 120 Kennedy Ave
- 283 Esther Ave
- 325 N 3rd St Unit 4
- 3887 Via Salice
- 990 Gale Dr
- 110 S 1st St Unit 110
- 375 N 3rd St Unit 3
- 433 W Rincon Ave
- 433 W Rincon Ave Unit F
- 433 W Rincon Ave Unit E
- 433 W Rincon Ave Unit D
- 433 W Rincon Ave Unit B
- 433 W Rincon Ave Unit A
- 433 W Rincon Ave Unit M
- 433 W Rincon Ave Unit K
- 434 W Campbell Ave
- 432 W Campbell Ave
- 436 W Campbell Ave
- 430 W Campbell Ave
- 438 W Campbell Ave
- 428 W Campbell Ave
- 429 W Rincon Ave
- 429 W Rincon Ave Unit F
- 429 W Rincon Ave Unit E
- 429 W Rincon Ave Unit D
- 429 W Rincon Ave Unit C
- 429 W Rincon Ave Unit B