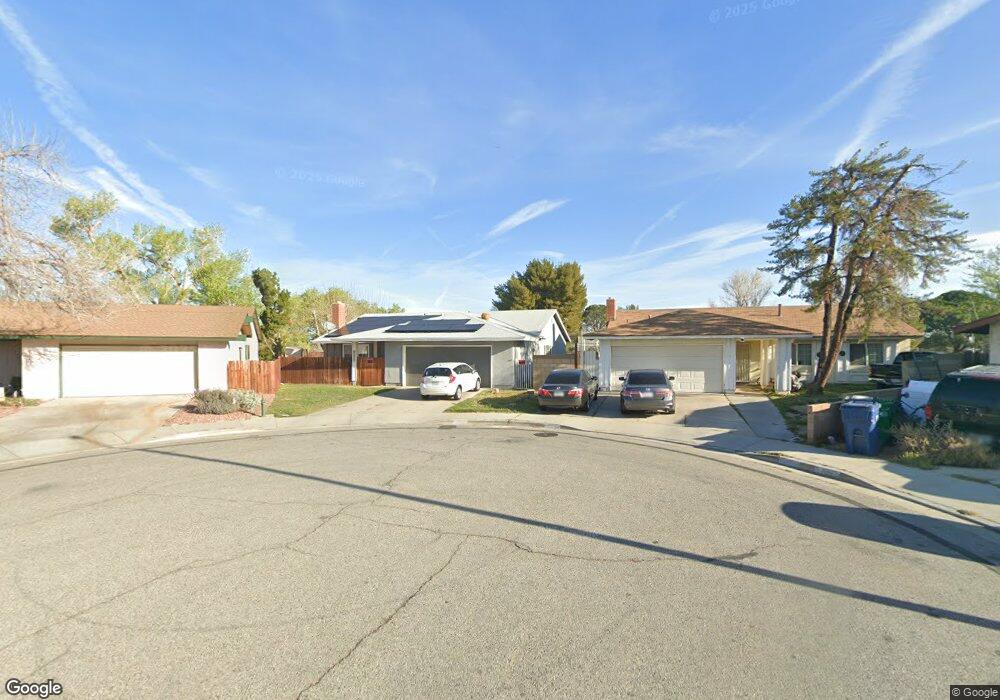
44241 Hanstead Ave Lancaster, CA 93535
East Lancaster NeighborhoodEstimated Value: $385,676 - $426,000
3
Beds
2
Baths
1,440
Sq Ft
$279/Sq Ft
Est. Value
About This Home
This home is located at 44241 Hanstead Ave, Lancaster, CA 93535 and is currently estimated at $401,669, approximately $278 per square foot. 44241 Hanstead Ave is a home located in Los Angeles County with nearby schools including Joshua Elementary, New Vista Middle School, and Antelope Valley High School.
Ownership History
Date
Name
Owned For
Owner Type
Purchase Details
Closed on
Feb 23, 2010
Sold by
Federal National Mortgage Association
Bought by
Harper Paul D
Current Estimated Value
Home Financials for this Owner
Home Financials are based on the most recent Mortgage that was taken out on this home.
Original Mortgage
$80,000
Outstanding Balance
$52,787
Interest Rate
4.97%
Mortgage Type
New Conventional
Estimated Equity
$348,882
Purchase Details
Closed on
Oct 22, 2009
Sold by
Sanchez Bernard and Dror Annat
Bought by
Federal National Mortgage Association
Purchase Details
Closed on
Aug 2, 2005
Sold by
Lidh Richard D and Lidh Linda M
Bought by
Sanchez Bernard
Home Financials for this Owner
Home Financials are based on the most recent Mortgage that was taken out on this home.
Original Mortgage
$215,200
Interest Rate
1%
Mortgage Type
Negative Amortization
Create a Home Valuation Report for This Property
The Home Valuation Report is an in-depth analysis detailing your home's value as well as a comparison with similar homes in the area
Home Values in the Area
Average Home Value in this Area
Purchase History
We collect this data history from publicly available records. To have your information removed, we recommend requesting removal directly through your county’s website.
| Date | Buyer | Sale Price | Title Company |
|---|---|---|---|
| Harper Paul D | $100,000 | Lawyers Title Company | |
| Federal National Mortgage Association | $186,110 | Landsafe Title | |
| Sanchez Bernard | $269,000 | Lawyers Title |
Source: Public Records
Mortgage History
We collect this data history from publicly available records. To have your information removed, we recommend requesting removal directly through your county’s website.
| Date | Status | Borrower | Loan Amount |
|---|---|---|---|
| Open | Harper Paul D | $80,000 | |
| Previous Owner | Sanchez Bernard | $215,200 |
Source: Public Records
Tax History
| Year | Tax Paid | Tax Assessment Tax Assessment Total Assessment is a certain percentage of the fair market value that is determined by local assessors to be the total taxable value of land and additions on the property. | Land | Improvement |
|---|---|---|---|---|
| 2025 | $2,821 | $129,069 | $25,809 | $103,260 |
| 2024 | $2,821 | $126,539 | $25,303 | $101,236 |
| 2023 | $2,763 | $124,058 | $24,807 | $99,251 |
| 2022 | $2,582 | $121,626 | $24,321 | $97,305 |
| 2021 | $2,203 | $119,243 | $23,845 | $95,398 |
| 2020 | $2,180 | $118,021 | $23,601 | $94,420 |
| 2019 | $2,145 | $115,708 | $23,139 | $92,569 |
| 2018 | $2,108 | $113,440 | $22,686 | $90,754 |
| 2016 | $2,001 | $109,037 | $21,806 | $87,231 |
| 2015 | $1,978 | $107,400 | $21,479 | $85,921 |
| 2014 | $1,981 | $105,297 | $21,059 | $84,238 |
Source: Public Records
Map
Nearby Homes
- 44414 Andale Ave
- 736 E Avenue j6
- 519 E Avenue J 4
- 8800 E Pillsbury St
- 834 E Avenue j6
- 1017 E Avenue j5
- 44415 Watford Ave
- 44513 Tabler St
- 44422 Sancroft Ave
- 44047 Rodin Ave
- 0 5th St E Unit IG26101332
- 0 5th St E Unit 26003797
- 44022 Andale Ave
- 1010 E Avenue j6
- 44117 Sancroft Ave
- 44532 Andale Ave
- 44509 Watford Ave
- 44309 Gingham Ave
- 1112 E Avenue j4
- 646 E Nugent St
- 44260 Tabler St
- 44260 N Tabler Ave
- 44254 Tabler St
- 44239 Hanstead Ave
- 44246 Tabler St
- 664 Woodington Dr
- 44233 Hanstead Ave
- 669 Eston Place
- 44240 Tabler St
- 658 Woodington Dr
- 44229 Hanstead Ave
- 44240 Hanstead Ave
- 663 Eston Place Unit B
- 663 Eston Place Unit A
- 663 Eston Place Unit 2
- 663 Eston Place
- 44221 Hanstead Ave
- 652 Woodington Dr
- 44232 Tabler St
- 0 E Vic 7th St and Ave
Your Personal Tour Guide
Ask me questions while you tour the home.