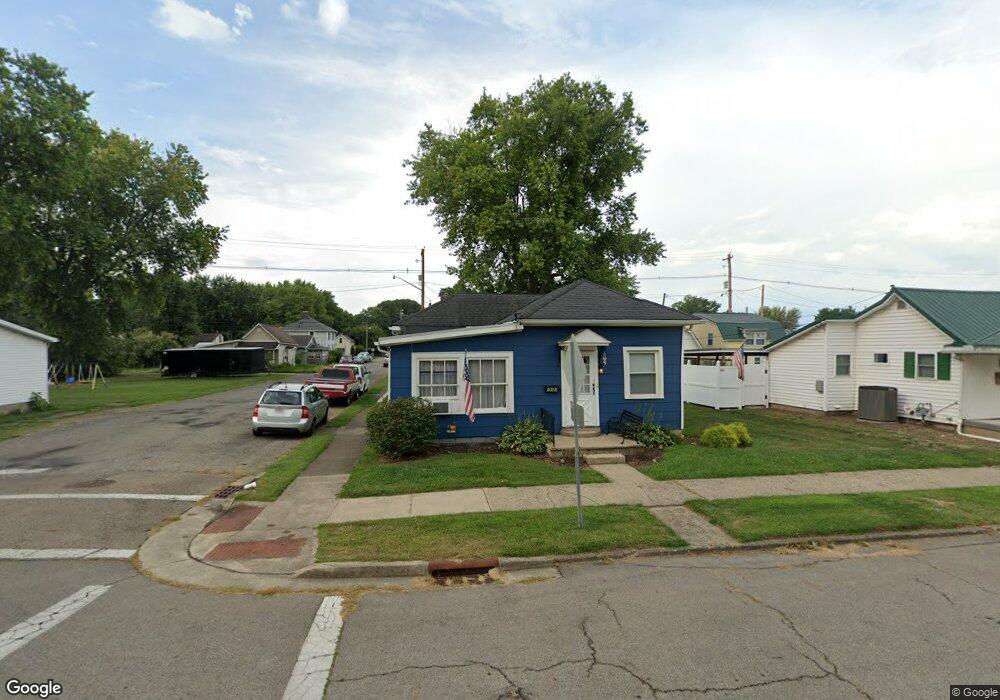
443 E Mound St Circleville, OH 43113
Estimated Value: $120,000 - $167,000
3
Beds
1
Bath
1,288
Sq Ft
$112/Sq Ft
Est. Value
About This Home
This home is located at 443 E Mound St, Circleville, OH 43113 and is currently estimated at $143,841, approximately $111 per square foot. 443 E Mound St is a home located in Pickaway County with nearby schools including Circleville High School, Crossroads Christian Academy, and New Hope Christian Academy.
Ownership History
Date
Name
Owned For
Owner Type
Purchase Details
Closed on
Jun 10, 2005
Sold by
Hud
Bought by
Abrigg Gerald and Abrigg Karen
Current Estimated Value
Purchase Details
Closed on
Jan 25, 2005
Sold by
Clay Ruby L and Abn Amro Mortgage Group Inc
Bought by
Hud
Purchase Details
Closed on
Sep 23, 2002
Sold by
Conrad David M
Bought by
Clay Ruby L
Home Financials for this Owner
Home Financials are based on the most recent Mortgage that was taken out on this home.
Original Mortgage
$57,545
Interest Rate
6.4%
Mortgage Type
FHA
Purchase Details
Closed on
Aug 28, 2001
Sold by
Beneficial Mtg Co Of Oh
Bought by
Conrad Dream L and Conrad David M
Home Financials for this Owner
Home Financials are based on the most recent Mortgage that was taken out on this home.
Original Mortgage
$36,900
Interest Rate
7.28%
Mortgage Type
New Conventional
Purchase Details
Closed on
May 8, 2001
Sold by
Mary C Melosh Pr Shrf
Bought by
Beneficial Mtg Co Of Ohio
Create a Home Valuation Report for This Property
The Home Valuation Report is an in-depth analysis detailing your home's value as well as a comparison with similar homes in the area
Home Values in the Area
Average Home Value in this Area
Purchase History
| Date | Buyer | Sale Price | Title Company |
|---|---|---|---|
| Abrigg Gerald | $47,930 | Lakeside Title | |
| Hud | $44,000 | None Available | |
| Clay Ruby L | $58,000 | -- | |
| Conrad Dream L | $41,000 | -- | |
| Beneficial Mtg Co Of Ohio | $40,000 | -- |
Source: Public Records
Mortgage History
| Date | Status | Borrower | Loan Amount |
|---|---|---|---|
| Previous Owner | Clay Ruby L | $57,545 | |
| Previous Owner | Conrad Dream L | $36,900 |
Source: Public Records
Tax History
| Year | Tax Paid | Tax Assessment Tax Assessment Total Assessment is a certain percentage of the fair market value that is determined by local assessors to be the total taxable value of land and additions on the property. | Land | Improvement |
|---|---|---|---|---|
| 2025 | $2,096 | $27,680 | $6,860 | $20,820 |
| 2024 | $2,096 | $27,680 | $6,860 | $20,820 |
| 2023 | $998 | $27,680 | $6,860 | $20,820 |
| 2022 | $1,005 | $22,140 | $5,740 | $16,400 |
| 2021 | $1,011 | $22,140 | $5,740 | $16,400 |
| 2020 | $1,011 | $22,140 | $5,740 | $16,400 |
| 2019 | $914 | $18,660 | $5,740 | $12,920 |
| 2018 | $936 | $18,660 | $5,740 | $12,920 |
| 2017 | $929 | $18,660 | $5,740 | $12,920 |
| 2016 | $904 | $17,880 | $6,280 | $11,600 |
| 2015 | $905 | $17,880 | $6,280 | $11,600 |
| 2014 | $902 | $17,880 | $6,280 | $11,600 |
| 2013 | $973 | $19,000 | $6,280 | $12,720 |
Source: Public Records
Map
Nearby Homes
- 446 E Franklin St
- 378 E Franklin St
- 575 Renick Ave
- 531 E Franklin St
- 405 Watt St
- 528 E Ohio St
- 461 Watt St
- 551 E Main St
- 430 Ruth Ave
- 207 E Mill St
- 321 S Pickaway St
- 416 Stella Ave
- 125 N Pickaway St
- 837 Clinton St
- 231 Westwood Dr
- 0 Ohio 56 Unit 226002334
- 180 Nicholas Dr
- 348 Walnut St
- 339 Walnut St
- 134 Fairview Blvd
- 439 E Mound St
- 433 E Mound St
- 503 E Mound St
- 429 E Mound St
- 507 E Mound St
- 425 E Mound St
- 444 E Union St
- 318 Abernathy Ave
- 440 E Union St
- 513 E Mound St
- 509 E Mound St
- 423 E Mound St
- 434 E Union St
- 320 Abernathy Ave
- 430 E Union St
- 520 E Union St
- 520 E Abernathy Ave
- 426 E Union St
- 504 E Union St
- 420 E Union St
Your Personal Tour Guide
Ask me questions while you tour the home.