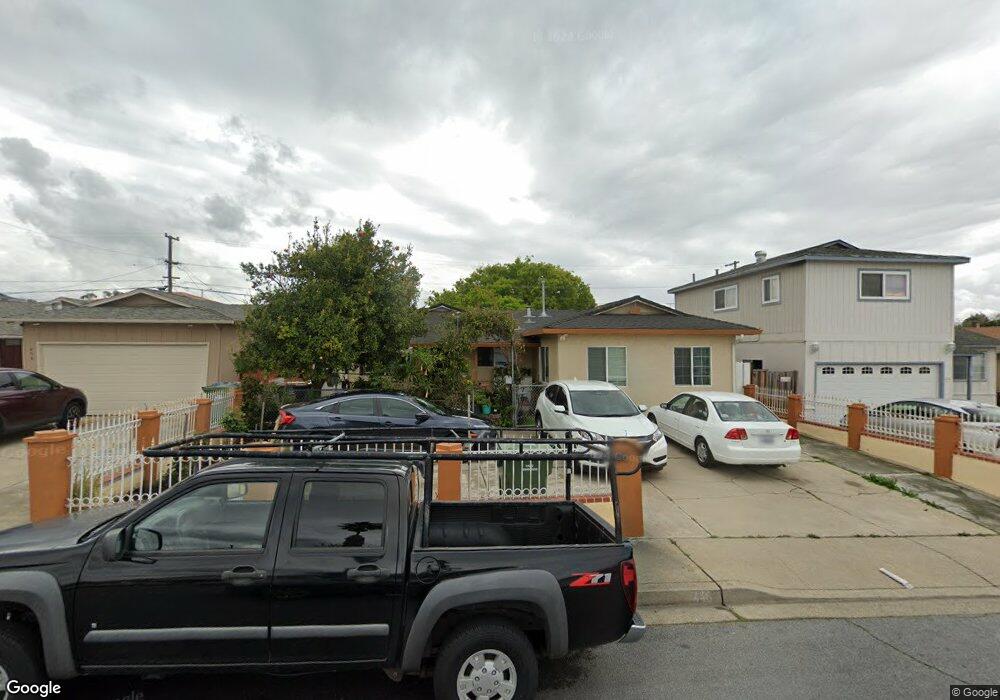
446 Matthews Ct Milpitas, CA 95035
Estimated Value: $1,415,000 - $1,612,410
4
Beds
2
Baths
1,085
Sq Ft
$1,398/Sq Ft
Est. Value
About This Home
This home is located at 446 Matthews Ct, Milpitas, CA 95035 and is currently estimated at $1,516,853, approximately $1,398 per square foot. 446 Matthews Ct is a home located in Santa Clara County with nearby schools including Joseph Weller Elementary School, Thomas Russell Middle School, and Milpitas High School.
Ownership History
Date
Name
Owned For
Owner Type
Purchase Details
Closed on
Nov 20, 2024
Sold by
Salvador Al Bartolome and Jedidia Macapula
Bought by
Living Trust and Salvador
Current Estimated Value
Purchase Details
Closed on
Sep 9, 2008
Sold by
Salvador Mellownie A
Bought by
Salvador Al Bartolome and Salvador Jedidia
Purchase Details
Closed on
Oct 28, 2004
Sold by
Salvador Al Bartolome
Bought by
Salvador Al Bartolome and Salvador Jedidia
Home Financials for this Owner
Home Financials are based on the most recent Mortgage that was taken out on this home.
Original Mortgage
$92,000
Interest Rate
5.69%
Mortgage Type
New Conventional
Purchase Details
Closed on
May 25, 2004
Sold by
Salvador Jedidia Macapulay
Bought by
Salvador Al Bartolome
Create a Home Valuation Report for This Property
The Home Valuation Report is an in-depth analysis detailing your home's value as well as a comparison with similar homes in the area
Home Values in the Area
Average Home Value in this Area
Purchase History
| Date | Buyer | Sale Price | Title Company |
|---|---|---|---|
| Living Trust | -- | None Listed On Document | |
| Salvador Al Bartolome | -- | None Available | |
| Salvador Al Bartolome | -- | Alliance Title Company | |
| Salvador Al Bartolome | -- | Fidelity National Title Ins | |
| Salvador Al Bartolome | $5,000 | Fidelity National Title Ins | |
| Salvador Al Bartolome | $5,000 | Fidelity National Title Ins |
Source: Public Records
Mortgage History
| Date | Status | Borrower | Loan Amount |
|---|---|---|---|
| Previous Owner | Salvador Al Bartolome | $92,000 |
Source: Public Records
Tax History
| Year | Tax Paid | Tax Assessment Tax Assessment Total Assessment is a certain percentage of the fair market value that is determined by local assessors to be the total taxable value of land and additions on the property. | Land | Improvement |
|---|---|---|---|---|
| 2025 | $5,296 | $463,125 | $174,489 | $288,636 |
| 2024 | $5,296 | $454,045 | $171,068 | $282,977 |
| 2023 | $5,277 | $445,143 | $167,714 | $277,429 |
| 2022 | $5,256 | $436,416 | $164,426 | $271,990 |
| 2021 | $5,177 | $427,859 | $161,202 | $266,657 |
| 2020 | $5,086 | $423,473 | $159,550 | $263,923 |
| 2019 | $5,028 | $415,171 | $156,422 | $258,749 |
| 2018 | $4,625 | $394,051 | $153,355 | $240,696 |
| 2017 | $3,374 | $283,365 | $150,349 | $133,016 |
| 2016 | $3,231 | $277,809 | $147,401 | $130,408 |
| 2015 | $3,196 | $273,637 | $145,187 | $128,450 |
| 2014 | $3,097 | $268,277 | $142,343 | $125,934 |
Source: Public Records
Map
Nearby Homes
- 479 Dixon Rd
- 1637 Roger St
- 390 Valmy St
- 210 Sunnyhills Ct Unit 10
- 1308 N Hillview Dr
- 2000 Scott Creek Rd
- 60 Wilson Way Unit 43
- 60 Wilson Way Unit 104
- 60 Wilson Way Unit 150
- 60 Wilson Way Unit 55
- 272 Fountain Grass Terrace
- 465 Wilaneta Ave
- 48962 Woodgrove Common Unit 143
- 1000 Jacklin Rd
- 1103 Creed St
- 582 Ginkgo Terrace
- 60 Jacklin Place
- 685 Parvin Dr
- 48611 Tonopah Ct
- 1279 Milkweed St
- 454 Matthews Ct
- 438 Matthews Ct
- 430 Matthews Ct
- 462 Matthews Ct
- 451 Woodcock Ct
- 443 Woodcock Ct
- 459 Woodcock Ct
- 435 Woodcock Ct
- 422 Matthews Ct
- 441 Matthews Ct
- 427 Woodcock Ct
- 449 Matthews Ct
- 470 Matthews Ct
- 433 Matthews Ct
- 467 Woodcock Ct
- 414 Matthews Ct
- 457 Matthews Ct
- 425 Matthews Ct
- 478 Matthews Ct
- 419 Woodcock Ct
Your Personal Tour Guide
Ask me questions while you tour the home.