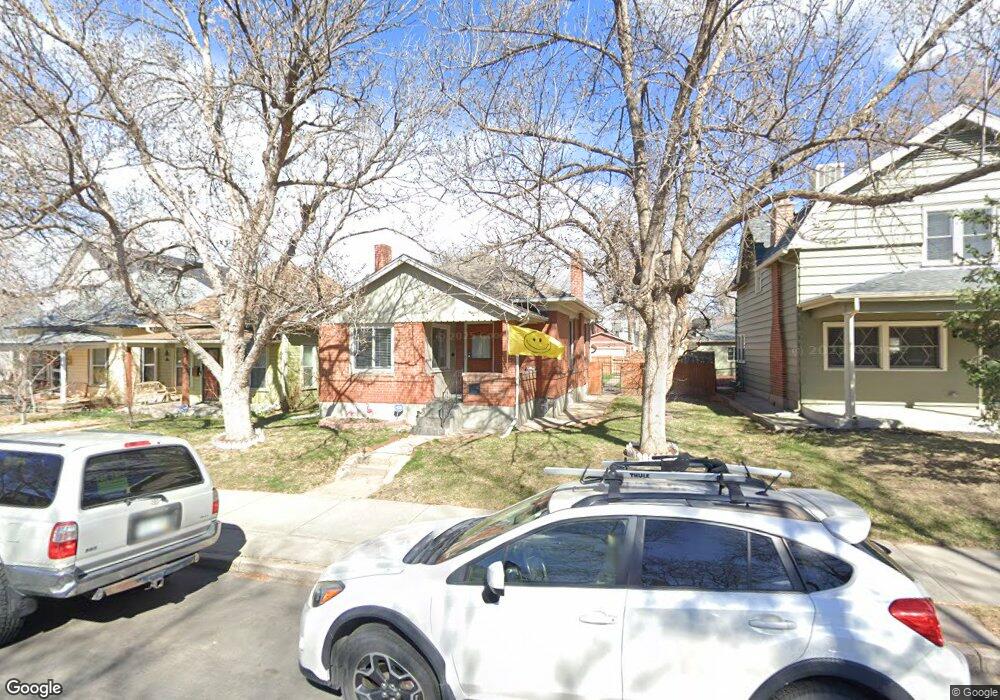
4476 Stuart St Denver, CO 80212
Berkeley NeighborhoodEstimated Value: $772,029 - $817,000
2
Beds
1
Bath
1,303
Sq Ft
$611/Sq Ft
Est. Value
About This Home
This home is located at 4476 Stuart St, Denver, CO 80212 and is currently estimated at $796,257, approximately $611 per square foot. 4476 Stuart St is a home located in Denver County with nearby schools including Bryant Webster Dual Language School, Skinner Middle School, and Denver Montessori Junior/Senior High School.
Ownership History
Date
Name
Owned For
Owner Type
Purchase Details
Closed on
Apr 13, 2012
Sold by
Tichota Clay Wesley and Tichota Tricia Marie
Bought by
Moghadamnia Sharon M and Sharon M Moghadamnia Living Trust
Current Estimated Value
Purchase Details
Closed on
Jan 22, 2009
Sold by
Tichota Clay Wesley and Wilson Tricia Marie
Bought by
Tichota Clay Wesley and Tichota Tricia Marie
Home Financials for this Owner
Home Financials are based on the most recent Mortgage that was taken out on this home.
Original Mortgage
$206,348
Interest Rate
5.17%
Mortgage Type
FHA
Purchase Details
Closed on
Sep 5, 2008
Sold by
Mautino John A
Bought by
Tichota Clay Wesley and Wilson Tricia Marie
Home Financials for this Owner
Home Financials are based on the most recent Mortgage that was taken out on this home.
Original Mortgage
$203,299
Interest Rate
6.66%
Mortgage Type
FHA
Purchase Details
Closed on
Oct 12, 1995
Sold by
Caporiccio Attilio F and Caporiccio Edna M
Bought by
Caporiccio Attilio F
Create a Home Valuation Report for This Property
The Home Valuation Report is an in-depth analysis detailing your home's value as well as a comparison with similar homes in the area
Home Values in the Area
Average Home Value in this Area
Purchase History
| Date | Buyer | Sale Price | Title Company |
|---|---|---|---|
| Moghadamnia Sharon M | $304,500 | Fidelity National Title Insu | |
| Tichota Clay Wesley | -- | Chicago Title Co | |
| Tichota Clay Wesley | $207,000 | None Available | |
| Caporiccio Attilio F | -- | -- |
Source: Public Records
Mortgage History
| Date | Status | Borrower | Loan Amount |
|---|---|---|---|
| Previous Owner | Tichota Clay Wesley | $206,348 | |
| Previous Owner | Tichota Clay Wesley | $203,299 |
Source: Public Records
Tax History
| Year | Tax Paid | Tax Assessment Tax Assessment Total Assessment is a certain percentage of the fair market value that is determined by local assessors to be the total taxable value of land and additions on the property. | Land | Improvement |
|---|---|---|---|---|
| 2025 | $4,355 | $59,520 | $59,450 | $59,450 |
| 2024 | $4,355 | $54,980 | $54,910 | $70 |
| 2023 | $4,260 | $54,980 | $54,910 | $70 |
| 2022 | $3,113 | $39,140 | $39,070 | $70 |
| 2021 | $3,005 | $40,270 | $40,200 | $70 |
| 2020 | $2,760 | $37,200 | $35,730 | $1,470 |
| 2019 | $2,683 | $37,200 | $35,730 | $1,470 |
| 2018 | $2,431 | $31,420 | $25,860 | $5,560 |
| 2017 | $2,424 | $31,420 | $25,860 | $5,560 |
| 2016 | $2,265 | $27,780 | $23,617 | $4,163 |
| 2015 | $2,170 | $27,780 | $23,617 | $4,163 |
| 2014 | $1,892 | $22,780 | $14,917 | $7,863 |
Source: Public Records
Map
Nearby Homes
- 4460 Tennyson St Unit 7
- 4465 Stuart St
- 4441 Stuart St
- 4511 Tennyson St
- 4515 Tennyson St
- 4517 Tennyson St
- 4474 Utica St
- 4516 Stuart St
- 4450 Utica St
- 4512 Utica St
- 4520 S Utica St
- 4537 Tennyson St Unit 101
- 4539 Tennyson St Unit 109
- 4539 Tennyson St Unit 107
- 4535 Utica St
- 4574 Stuart St
- 4576 Stuart St
- 4551 Utica St
- 4477 Vrain St
- 4513 Vrain St
- 4478 Stuart St
- 4468 Stuart St
- 4480 Stuart St
- 4490 Stuart St
- 4494 Stuart St
- 4456 Stuart St
- 4485 Stuart St
- 4473 Stuart St
- 4471 Stuart St
- 4475 Stuart St
- 4495 Stuart St
- 4461 Stuart St
- 4204 W 45th Ave
- 4481 Raleigh St
- 4455 Stuart St
- 4477 Raleigh St
- 4471 Raleigh St
- 4444 Stuart St
- 4500 Stuart St
- 4442 Stuart St
Your Personal Tour Guide
Ask me questions while you tour the home.