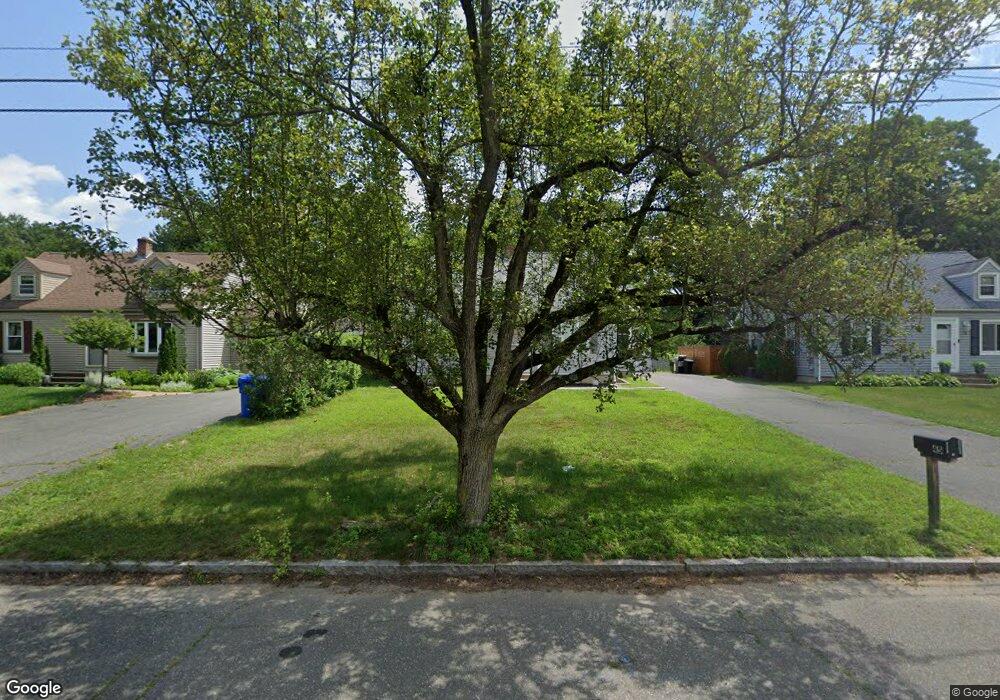
45 Lumae St Springfield, MA 01119
Sixteen Acres NeighborhoodEstimated Value: $307,378 - $327,000
4
Beds
2
Baths
1,344
Sq Ft
$237/Sq Ft
Est. Value
About This Home
This home is located at 45 Lumae St, Springfield, MA 01119 and is currently estimated at $318,095, approximately $236 per square foot. 45 Lumae St is a home located in Hampden County with nearby schools including Glickman Elementary, John J Duggan Middle, and Springfield High School of Science and Technology.
Ownership History
Date
Name
Owned For
Owner Type
Purchase Details
Closed on
Jun 15, 2018
Sold by
Normand Laura A and Cote Steven A
Bought by
Paige Michele L
Current Estimated Value
Home Financials for this Owner
Home Financials are based on the most recent Mortgage that was taken out on this home.
Original Mortgage
$152,192
Outstanding Balance
$131,621
Interest Rate
4.5%
Mortgage Type
FHA
Estimated Equity
$186,474
Purchase Details
Closed on
Jan 14, 2005
Sold by
Cote Anne H and Cote Francis E
Bought by
Normand Laura A and Cote Steven A
Create a Home Valuation Report for This Property
The Home Valuation Report is an in-depth analysis detailing your home's value as well as a comparison with similar homes in the area
Home Values in the Area
Average Home Value in this Area
Purchase History
| Date | Buyer | Sale Price | Title Company |
|---|---|---|---|
| Paige Michele L | $155,000 | -- | |
| Normand Laura A | -- | -- |
Source: Public Records
Mortgage History
| Date | Status | Borrower | Loan Amount |
|---|---|---|---|
| Open | Paige Michele L | $152,192 |
Source: Public Records
Tax History
| Year | Tax Paid | Tax Assessment Tax Assessment Total Assessment is a certain percentage of the fair market value that is determined by local assessors to be the total taxable value of land and additions on the property. | Land | Improvement |
|---|---|---|---|---|
| 2025 | $3,755 | $239,500 | $51,400 | $188,100 |
| 2024 | $3,832 | $238,600 | $51,400 | $187,200 |
| 2023 | $3,316 | $194,500 | $49,000 | $145,500 |
| 2022 | $3,154 | $167,600 | $49,000 | $118,600 |
| 2021 | $2,992 | $158,300 | $44,500 | $113,800 |
| 2020 | $3,029 | $155,100 | $44,500 | $110,600 |
| 2019 | $2,991 | $152,000 | $44,500 | $107,500 |
| 2018 | $3,039 | $154,400 | $44,500 | $109,900 |
| 2017 | $2,829 | $143,900 | $44,000 | $99,900 |
| 2016 | $2,684 | $136,500 | $44,000 | $92,500 |
| 2015 | $2,640 | $134,200 | $44,000 | $90,200 |
Source: Public Records
Map
Nearby Homes
- 381 N Brook Rd
- Lot 37 Kane St
- 46 Puritan Cir
- 108 Birchland Ave
- 186 Bolton St
- 121 Mallowhill Rd
- 25 Nassau Dr Unit 25
- 71 Nassau Dr
- 44 Nassau Dr
- 73 Timber Ln
- 854 Grayson Dr
- 74 Valley Rd
- 106-108 Breckwood Cir
- 64 Wilmington St
- 130 Spear Rd
- 56 Contessa Ln
- 37 Middlebrook Dr
- 60 Jeanne Marie St
- 46 Overlea Dr
- 2306 Wilbraham Rd
Your Personal Tour Guide
Ask me questions while you tour the home.