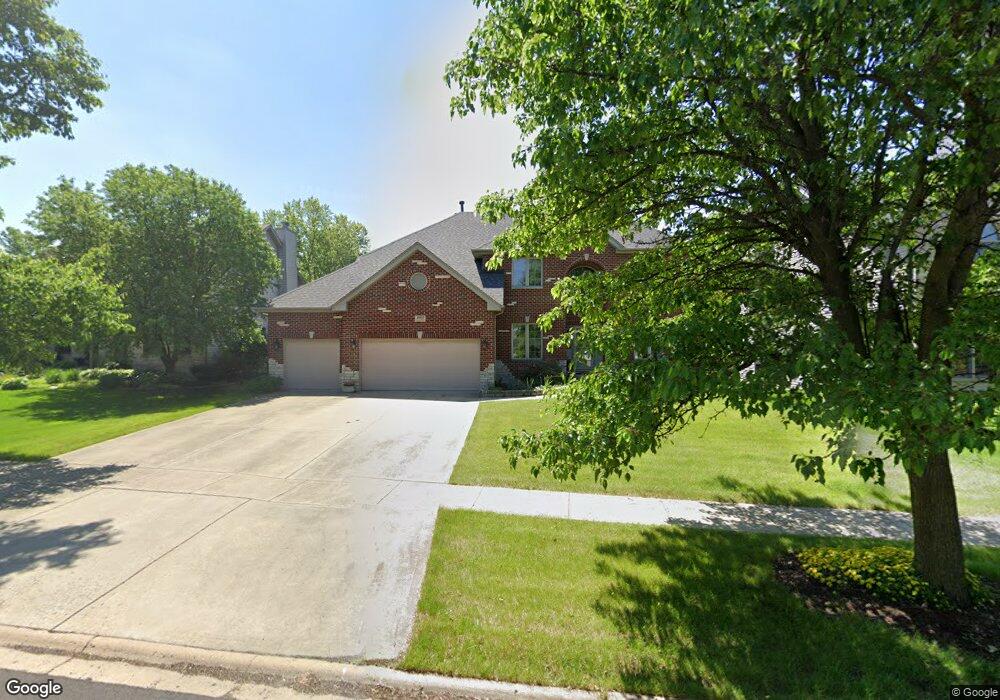
463 Sudbury Cir Unit 7 Oswego, IL 60543
South Oswego NeighborhoodEstimated Value: $519,000 - $557,000
4
Beds
3
Baths
2,974
Sq Ft
$179/Sq Ft
Est. Value
About This Home
This home is located at 463 Sudbury Cir Unit 7, Oswego, IL 60543 and is currently estimated at $532,634, approximately $179 per square foot. 463 Sudbury Cir Unit 7 is a home located in Kendall County with nearby schools including Prairie Point Elementary School, Traughber Junior High School, and Oswego High School.
Ownership History
Date
Name
Owned For
Owner Type
Purchase Details
Closed on
Jun 13, 2017
Sold by
Noble Bryan
Bought by
The Bryan Noble Living Trust
Current Estimated Value
Purchase Details
Closed on
May 23, 2006
Sold by
Noble Rebecca F
Bought by
Noble Bryan C
Home Financials for this Owner
Home Financials are based on the most recent Mortgage that was taken out on this home.
Original Mortgage
$245,386
Interest Rate
6.37%
Mortgage Type
Purchase Money Mortgage
Purchase Details
Closed on
Nov 7, 2003
Sold by
Mcdonnell Martin and Mcdonnell Elizabeth
Bought by
Noble Bryan C and Noble Rebecca F
Home Financials for this Owner
Home Financials are based on the most recent Mortgage that was taken out on this home.
Original Mortgage
$250,659
Interest Rate
3.67%
Mortgage Type
Purchase Money Mortgage
Purchase Details
Closed on
Apr 7, 2003
Sold by
Deerpath Development Corp
Bought by
Mcdonnell Martin and Mcdonnell Elizabeth
Create a Home Valuation Report for This Property
The Home Valuation Report is an in-depth analysis detailing your home's value as well as a comparison with similar homes in the area
Home Values in the Area
Average Home Value in this Area
Purchase History
| Date | Buyer | Sale Price | Title Company |
|---|---|---|---|
| The Bryan Noble Living Trust | -- | Attorney | |
| Noble Bryan C | -- | Stewart Title Guaranty Compa | |
| Noble Bryan C | $321,000 | Chicago Title Insurance Co | |
| Mcdonnell Martin | $118,000 | -- |
Source: Public Records
Mortgage History
| Date | Status | Borrower | Loan Amount |
|---|---|---|---|
| Previous Owner | Noble Bryan C | $245,386 | |
| Previous Owner | Noble Bryan C | $250,659 |
Source: Public Records
Tax History Compared to Growth
Tax History
| Year | Tax Paid | Tax Assessment Tax Assessment Total Assessment is a certain percentage of the fair market value that is determined by local assessors to be the total taxable value of land and additions on the property. | Land | Improvement |
|---|---|---|---|---|
| 2024 | $11,672 | $151,037 | $28,486 | $122,551 |
| 2023 | $10,432 | $133,661 | $25,209 | $108,452 |
| 2022 | $10,432 | $121,510 | $22,917 | $98,593 |
| 2021 | $10,065 | $113,561 | $21,418 | $92,143 |
| 2020 | $9,954 | $111,334 | $20,998 | $90,336 |
| 2019 | $9,860 | $108,703 | $20,998 | $87,705 |
| 2018 | $10,239 | $110,795 | $18,948 | $91,847 |
| 2017 | $10,001 | $103,546 | $17,708 | $85,838 |
| 2016 | $9,832 | $100,530 | $17,192 | $83,338 |
| 2015 | $5,048 | $98,559 | $16,855 | $81,704 |
| 2014 | -- | $95,688 | $16,364 | $79,324 |
| 2013 | -- | $95,688 | $16,364 | $79,324 |
Source: Public Records
Map
Nearby Homes
- 538 Sudbury Cir
- 406 Windsor Dr
- 609 Chestnut Dr
- 482 Deerfield Dr
- 483 Deerfield Dr
- 676 Cumberland Ln
- 668 Cumberland Ln
- 315 White Pines Ln
- 673 Cumberland Ln
- 770 Dartmouth Ln
- 777 Dartmouth Ln
- 851 Claridge Dr
- 639 Vista Dr
- 716 Pinehurst Ln
- 714 Pinehurst Ln
- 395 Danforth Dr
- 616 Briarwood Ln
- 318 Monica Ln
- 2489 Semillon St
- 2486 Semillon St
- 461 Sudbury Cir
- 465 Sudbury Cir Unit 7
- 459 Sudbury Cir
- 467 Sudbury Cir Unit 7
- 403 Sudbury Cir
- 407 Sudbury Cir
- 464 Sudbury Cir
- 457 Sudbury Cir
- 460 Sudbury Cir Unit 7
- 401 Sudbury Cir Unit 7
- 409 Sudbury Cir
- 466 Sudbury Cir
- 458 Sudbury Cir
- 411 Sudbury Cir
- 455 Sudbury Cir Unit 7
- 603 Sudbury Cir
- 456 Sudbury Cir
- 413 Sudbury Cir Unit 7
- 601 Sudbury Cir Unit 6/6
- 453 Sudbury Cir