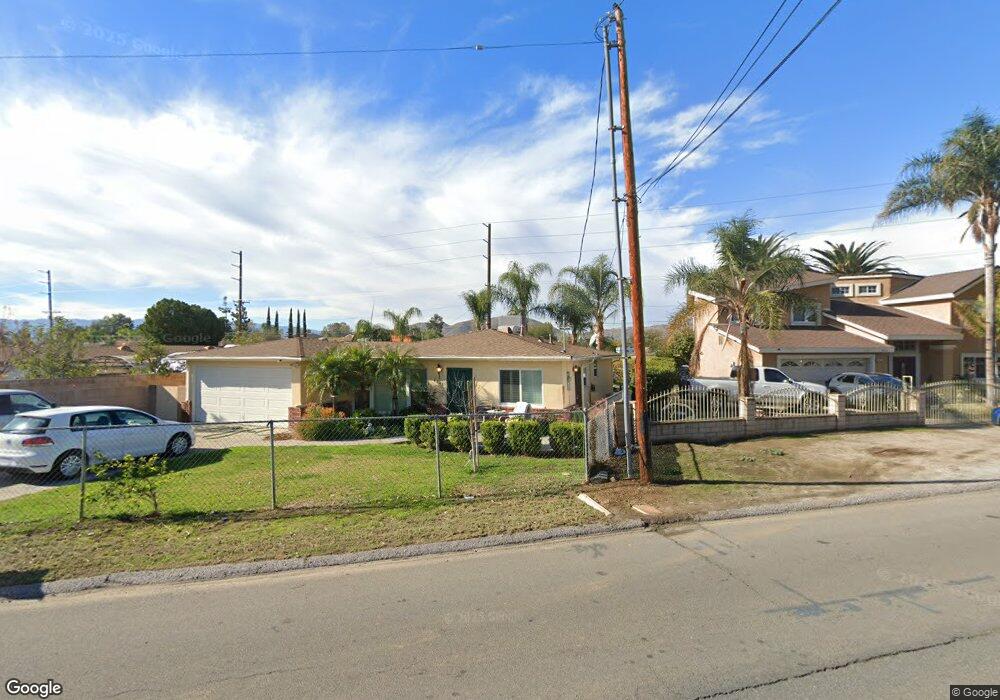
4688 Mobley Ave Riverside, CA 92505
La Sierra NeighborhoodEstimated Value: $448,000 - $502,000
2
Beds
1
Bath
896
Sq Ft
$534/Sq Ft
Est. Value
About This Home
This home is located at 4688 Mobley Ave, Riverside, CA 92505 and is currently estimated at $478,250, approximately $533 per square foot. 4688 Mobley Ave is a home located in Riverside County with nearby schools including Myra Linn Elementary School, Arizona Middle School, and La Sierra High School.
Ownership History
Date
Name
Owned For
Owner Type
Purchase Details
Closed on
Aug 2, 2016
Sold by
Garner Joe Neal
Bought by
Garner Joe Neal and Garner Mae Irene Reynolds
Current Estimated Value
Purchase Details
Closed on
Mar 30, 2001
Sold by
Nichols John R and Nichols Patricia A
Bought by
Garner Joe Neal
Home Financials for this Owner
Home Financials are based on the most recent Mortgage that was taken out on this home.
Original Mortgage
$95,000
Interest Rate
7.06%
Create a Home Valuation Report for This Property
The Home Valuation Report is an in-depth analysis detailing your home's value as well as a comparison with similar homes in the area
Home Values in the Area
Average Home Value in this Area
Purchase History
| Date | Buyer | Sale Price | Title Company |
|---|---|---|---|
| Garner Joe Neal | -- | None Available | |
| Garner Joe Neal | $100,000 | First American Title Co |
Source: Public Records
Mortgage History
| Date | Status | Borrower | Loan Amount |
|---|---|---|---|
| Previous Owner | Garner Joe Neal | $95,000 |
Source: Public Records
Tax History
| Year | Tax Paid | Tax Assessment Tax Assessment Total Assessment is a certain percentage of the fair market value that is determined by local assessors to be the total taxable value of land and additions on the property. | Land | Improvement |
|---|---|---|---|---|
| 2025 | $1,927 | $157,092 | $52,722 | $104,370 |
| 2023 | $1,927 | $150,994 | $50,676 | $100,318 |
| 2022 | $1,785 | $148,034 | $49,683 | $98,351 |
| 2021 | $1,768 | $145,132 | $48,709 | $96,423 |
| 2020 | $1,741 | $143,645 | $48,210 | $95,435 |
| 2019 | $1,719 | $140,829 | $47,265 | $93,564 |
| 2018 | $1,613 | $138,069 | $46,339 | $91,730 |
| 2017 | $1,583 | $135,363 | $45,431 | $89,932 |
| 2016 | $1,556 | $132,710 | $44,541 | $88,169 |
| 2015 | $1,532 | $130,719 | $43,873 | $86,846 |
| 2014 | $1,524 | $128,160 | $43,014 | $85,146 |
Source: Public Records
Map
Nearby Homes
- 10372 Wells Ave
- 10495 Cook Ave
- 10520 Cook Ave
- 4834 Hedrick Ave
- 10710 Brookfield Dr
- 4979 Tyler Meadow Rd
- 5130 Hedrick Ave
- 4998 Bushnell Ave
- 10389 Brookway Place
- 4314 Baggett Dr
- 10450 Gramercy Place
- 0 Sunnyslope Ave
- 10514 Cameo Ct
- 10233 Clara Vista Ln
- 0 Cook Ave Unit PW25235031
- 0 Bushnell Ave
- 4389 Drexel Ave
- 5382 Crest Ave
- 5347 Crest Ave
- 11141 Gardenhurst Ct
- 4685 Jones Ave
- 4690 Mobley Ave
- 4683 Jones Ave
- 10498 Mull Ave
- 4670 Mobley Ave
- 4677 Mobley Ave
- 4679 Jones Ave
- 4687 Mobley Ave
- 4667 Mobley Ave
- 4656 Mobley Ave
- 10496 Mull Ave
- 4669 Jones Ave
- 10497 Mull Ave
- 4659 Mobley Ave
- 4698 Jones Ave
- 4640 Mobley Ave
- 10495 Mull Ave
- 10486 Mull Ave
- 4645 Mobley Ave
- 4678 Jones Ave
Your Personal Tour Guide
Ask me questions while you tour the home.