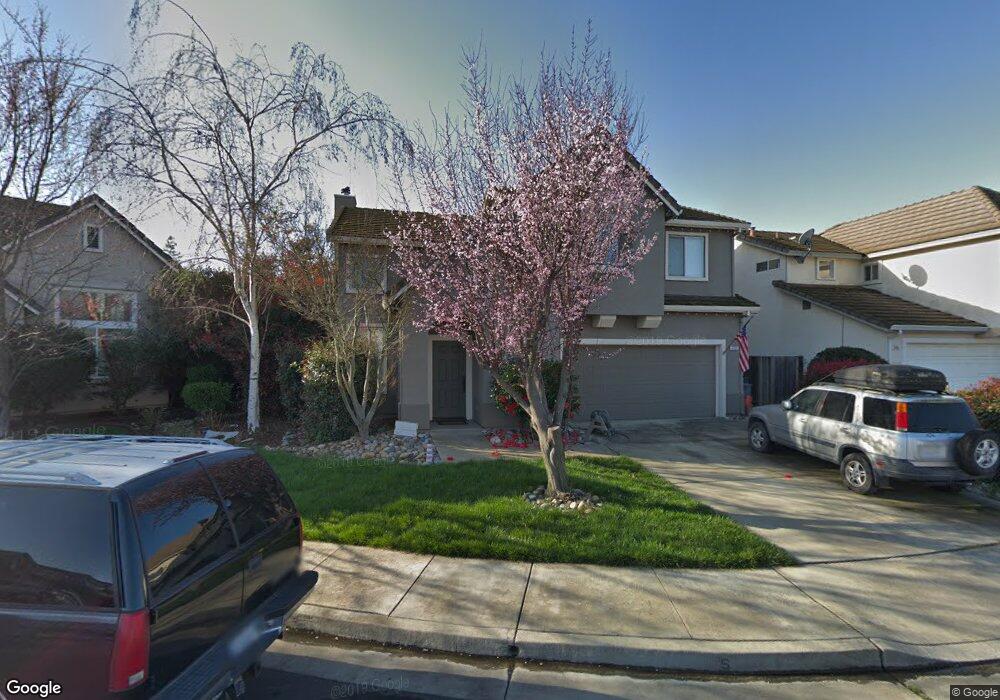
470 Canopy Ct Gilroy, CA 95020
Las Animas NeighborhoodEstimated Value: $866,000 - $952,000
4
Beds
3
Baths
1,829
Sq Ft
$497/Sq Ft
Est. Value
About This Home
This home is located at 470 Canopy Ct, Gilroy, CA 95020 and is currently estimated at $908,377, approximately $496 per square foot. 470 Canopy Ct is a home located in Santa Clara County with nearby schools including South Valley Middle School, Solorsano Middle School, and Christopher High School.
Ownership History
Date
Name
Owned For
Owner Type
Purchase Details
Closed on
Mar 27, 1998
Sold by
Warmington Gilroy Associates Lp
Bought by
Underwood John Allen and Underwood Debra Lyn
Current Estimated Value
Home Financials for this Owner
Home Financials are based on the most recent Mortgage that was taken out on this home.
Original Mortgage
$205,150
Outstanding Balance
$38,807
Interest Rate
7.06%
Estimated Equity
$869,570
Create a Home Valuation Report for This Property
The Home Valuation Report is an in-depth analysis detailing your home's value as well as a comparison with similar homes in the area
Home Values in the Area
Average Home Value in this Area
Purchase History
| Date | Buyer | Sale Price | Title Company |
|---|---|---|---|
| Underwood John Allen | $256,500 | First American Title Guarant |
Source: Public Records
Mortgage History
| Date | Status | Borrower | Loan Amount |
|---|---|---|---|
| Open | Underwood John Allen | $205,150 | |
| Closed | Underwood John Allen | $38,400 |
Source: Public Records
Tax History
| Year | Tax Paid | Tax Assessment Tax Assessment Total Assessment is a certain percentage of the fair market value that is determined by local assessors to be the total taxable value of land and additions on the property. | Land | Improvement |
|---|---|---|---|---|
| 2025 | $4,966 | $409,545 | $159,665 | $249,880 |
| 2024 | $4,966 | $401,516 | $156,535 | $244,981 |
| 2023 | $4,935 | $393,644 | $153,466 | $240,178 |
| 2022 | $4,851 | $385,926 | $150,457 | $235,469 |
| 2021 | $4,827 | $378,359 | $147,507 | $230,852 |
| 2020 | $4,773 | $374,480 | $145,995 | $228,485 |
| 2019 | $4,728 | $367,138 | $143,133 | $224,005 |
| 2018 | $4,415 | $359,940 | $140,327 | $219,613 |
| 2017 | $4,505 | $352,883 | $137,576 | $215,307 |
| 2016 | $4,409 | $345,965 | $134,879 | $211,086 |
| 2015 | $4,160 | $340,769 | $132,853 | $207,916 |
| 2014 | $4,132 | $334,095 | $130,251 | $203,844 |
Source: Public Records
Map
Nearby Homes
- 500 Ronan Ave
- 401 Arnold Dr
- 777 Lawrence Dr
- 833 Welburn Ave
- 119 Farrell Ave
- 103 Farrell Ave
- 111 Farrell Ave
- 735 Painter Ct
- 9190 Avezan Way
- 408 La Sierra Way
- 0 Magic Springs Dr Unit ML82028522
- 0 Dorrance Rd Unit ML82002071
- 0000 Hecker Pass
- 170 Sturla Way
- 626 Broadway
- 620 Broadway
- 622 Broadway
- 118 Chickadee Ln
- 7969 Kipling Cir
- 704 Tennyson Dr
Your Personal Tour Guide
Ask me questions while you tour the home.