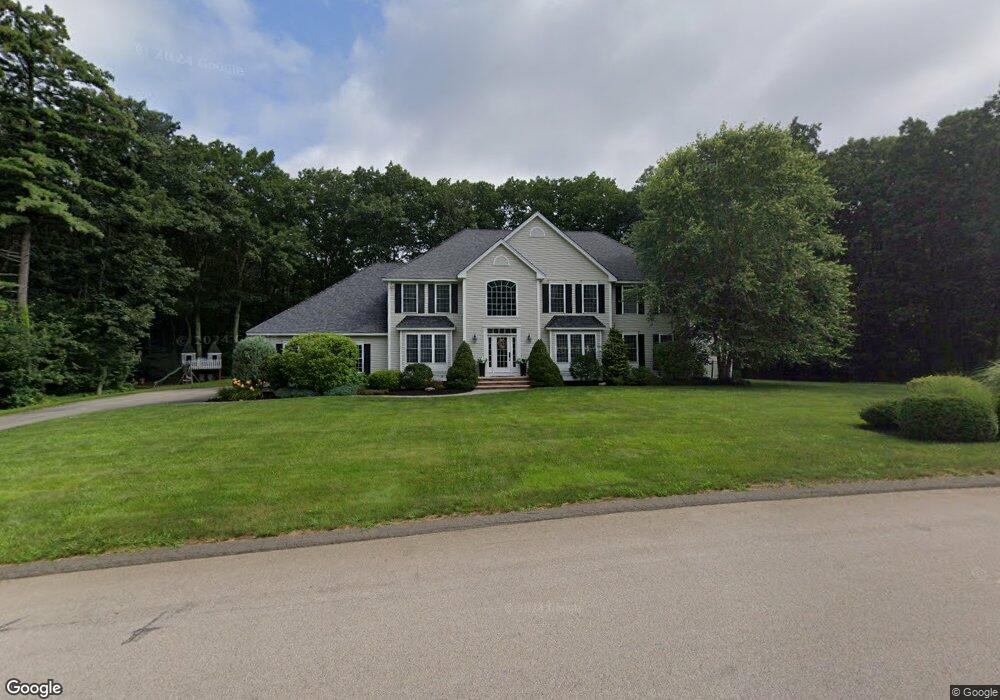
5 Cristy Rd Windham, NH 03087
Estimated Value: $1,211,729 - $1,542,000
4
Beds
4
Baths
3,160
Sq Ft
$424/Sq Ft
Est. Value
About This Home
This home is located at 5 Cristy Rd, Windham, NH 03087 and is currently estimated at $1,340,682, approximately $424 per square foot. 5 Cristy Rd is a home located in Rockingham County with nearby schools including Golden Brook Elementary School, Windham Middle School, and Windham High School.
Ownership History
Date
Name
Owned For
Owner Type
Purchase Details
Closed on
Jun 27, 2019
Sold by
Draeger Kyle D and Draeger Shelley
Bought by
Hachey Michael and Frost Andrea
Current Estimated Value
Home Financials for this Owner
Home Financials are based on the most recent Mortgage that was taken out on this home.
Original Mortgage
$480,000
Outstanding Balance
$422,066
Interest Rate
4%
Mortgage Type
Purchase Money Mortgage
Estimated Equity
$918,616
Purchase Details
Closed on
Apr 26, 2005
Sold by
Mhb Dev Corp
Bought by
Draeger Kyle and Draeger Shelley
Home Financials for this Owner
Home Financials are based on the most recent Mortgage that was taken out on this home.
Original Mortgage
$523,200
Interest Rate
6%
Mortgage Type
Adjustable Rate Mortgage/ARM
Create a Home Valuation Report for This Property
The Home Valuation Report is an in-depth analysis detailing your home's value as well as a comparison with similar homes in the area
Home Values in the Area
Average Home Value in this Area
Purchase History
| Date | Buyer | Sale Price | Title Company |
|---|---|---|---|
| Hachey Michael | $705,000 | -- | |
| Draeger Kyle | $654,900 | -- |
Source: Public Records
Mortgage History
| Date | Status | Borrower | Loan Amount |
|---|---|---|---|
| Open | Hachey Michael | $480,000 | |
| Previous Owner | Draeger Kyle | $523,200 |
Source: Public Records
Tax History Compared to Growth
Tax History
| Year | Tax Paid | Tax Assessment Tax Assessment Total Assessment is a certain percentage of the fair market value that is determined by local assessors to be the total taxable value of land and additions on the property. | Land | Improvement |
|---|---|---|---|---|
| 2024 | $15,538 | $686,300 | $219,500 | $466,800 |
| 2023 | $14,687 | $686,300 | $219,500 | $466,800 |
| 2022 | $13,561 | $686,300 | $219,500 | $466,800 |
| 2021 | $12,779 | $686,300 | $219,500 | $466,800 |
| 2020 | $13,129 | $686,300 | $219,500 | $466,800 |
| 2019 | $13,047 | $578,600 | $184,600 | $394,000 |
| 2018 | $13,476 | $578,600 | $184,600 | $394,000 |
| 2017 | $11,688 | $578,600 | $184,600 | $394,000 |
| 2016 | $12,603 | $577,600 | $184,600 | $393,000 |
| 2015 | $12,708 | $585,100 | $184,600 | $400,500 |
| 2014 | $12,278 | $511,600 | $214,000 | $297,600 |
| 2013 | $12,796 | $542,200 | $214,000 | $328,200 |
Source: Public Records
Map
Nearby Homes
- 1 Squire Armour Rd
- 6 Chadwick Cir
- 108 S Shore Rd
- 21 Lakeshore Rd
- 10 1st St
- 24 Rolling Ridge Rd
- 133 Brookdale Rd
- 54 Enterprise Dr
- 15 Enterprise Dr
- 3 S Shore Rd
- 95 Lake Shore Rd
- 219 Range Rd
- 14 Woodland Rd
- 2 Hall Ave
- 6-18 Mary Anthony Dr
- 1 Alpine Rd
- 45 Sharon Rd
- 7 Deer Run Rd
- 25 Range Rd
- 70 Governor Dinsmore Rd