2
Beds
2
Baths
6,756
Sq Ft
17.23
Acres
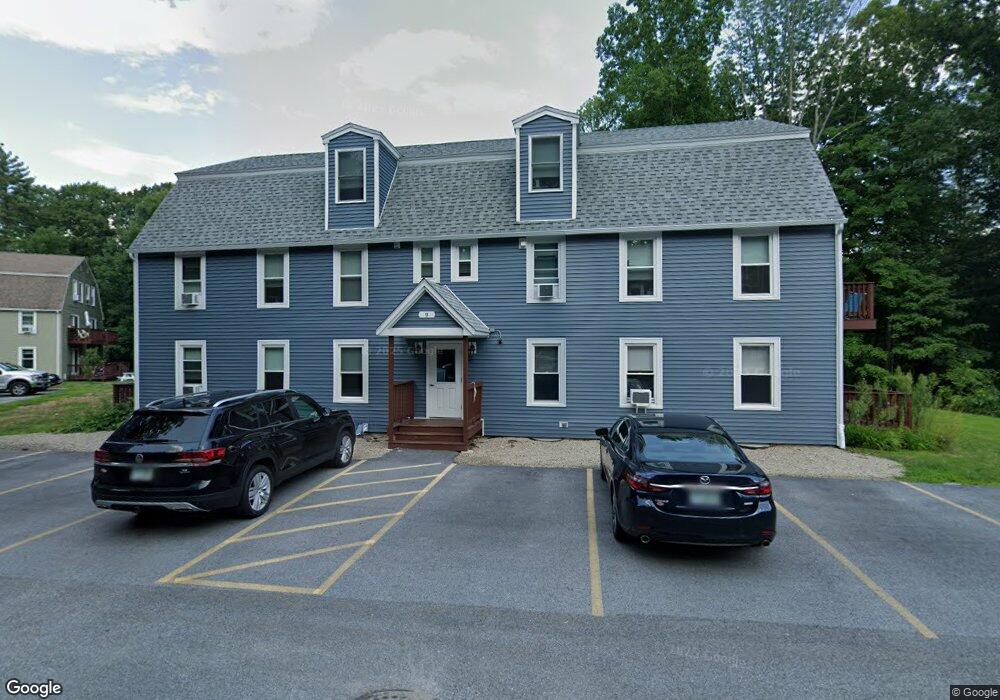
About This Home
This home is located at 5 Darby Field Common, Lee, NH 03861. 5 Darby Field Common is a home located in Strafford County with nearby schools including Mast Way School, Oyster River Middle School, and Oyster River High School.
Ownership History
Date
Name
Owned For
Owner Type
Purchase Details
Closed on
Sep 1, 2020
Sold by
70 Summit Llc
Bought by
Darby Field Commons Llc
Home Financials for this Owner
Home Financials are based on the most recent Mortgage that was taken out on this home.
Original Mortgage
$2,610,000
Outstanding Balance
$2,315,253
Interest Rate
3%
Mortgage Type
Purchase Money Mortgage
Purchase Details
Closed on
Sep 2, 2014
Sold by
Gct Realty Holdings Ll
Bought by
70 Summit Llc
Home Financials for this Owner
Home Financials are based on the most recent Mortgage that was taken out on this home.
Original Mortgage
$250,000
Interest Rate
4.14%
Mortgage Type
Commercial
Purchase Details
Closed on
Aug 19, 2011
Sold by
Ivy Rt
Bought by
Gct Realty Holdings Ll
Create a Home Valuation Report for This Property
The Home Valuation Report is an in-depth analysis detailing your home's value as well as a comparison with similar homes in the area
Home Values in the Area
Average Home Value in this Area
Purchase History
| Date | Buyer | Sale Price | Title Company |
|---|---|---|---|
| Darby Field Commons Llc | $2,525,000 | None Available | |
| Darby Field Commons Llc | $2,525,000 | None Available | |
| 70 Summit Llc | $2,184,000 | -- | |
| 70 Summit Llc | $2,184,000 | -- | |
| Gct Realty Holdings Ll | $1,730,000 | -- | |
| Gct Realty Holdings Ll | $1,730,000 | -- |
Source: Public Records
Mortgage History
| Date | Status | Borrower | Loan Amount |
|---|---|---|---|
| Open | Darby Field Commons Llc | $2,610,000 | |
| Closed | Darby Field Commons Llc | $2,610,000 | |
| Previous Owner | Gct Realty Holdings Ll | $250,000 |
Source: Public Records
Tax History Compared to Growth
Tax History
| Year | Tax Paid | Tax Assessment Tax Assessment Total Assessment is a certain percentage of the fair market value that is determined by local assessors to be the total taxable value of land and additions on the property. | Land | Improvement |
|---|---|---|---|---|
| 2024 | $72,200 | $2,801,700 | $751,100 | $2,050,600 |
| 2023 | $66,204 | $2,801,700 | $751,100 | $2,050,600 |
| 2022 | $60,853 | $2,801,700 | $751,100 | $2,050,600 |
| 2021 | $60,749 | $2,790,500 | $751,100 | $2,039,400 |
| 2020 | $67,890 | $2,130,900 | $111,100 | $2,019,800 |
| 2019 | $67,102 | $2,130,900 | $111,100 | $2,019,800 |
| 2018 | $5,556 | $2,130,900 | $111,100 | $2,019,800 |
| 2017 | $63,799 | $2,130,900 | $111,100 | $2,019,800 |
| 2016 | $62,326 | $2,130,800 | $111,100 | $2,019,700 |
| 2015 | $47,607 | $1,627,600 | $106,100 | $1,521,500 |
| 2014 | $48,340 | $1,627,600 | $106,100 | $1,521,500 |
| 2012 | $48,730 | $1,627,600 | $106,100 | $1,521,500 |
Source: Public Records
Map
Nearby Homes
- 384 N River Rd
- 288 N River Rd
- 20 Towle Rd
- 5 Hedding Rd
- 464 Wadleigh Falls Rd
- 113 N River Rd Unit Lot 2
- 23 Old Stagecoach Rd Unit 15
- 156 Hedding Rd
- 0 Rear Wadleigh Falls Rd Unit 9
- 153 Coffin Rd Unit 32
- 373 Calef Hwy
- 6 Hayden Place
- 22 Dorothy Dr
- 1 Mast Rd
- 35 Fieldstone Estates
- 27 Mulberry Ln
- 21A Highland Ave Unit 21A
- 1 Lee Hook Rd
- 290 Calef Hwy Unit A6
- 5 Langs Ln
- 5 Darby Field Common
- 107 Darby Field Common
- 18 Darby Field Common
- 3 Darby Field Commons
- 3 Darby Field Common
- 11 Darby Field Common Unit D
- 11 Darby Field Common Unit D
- 11 Darby Field Common Unit B
- 10 Darby Field Common Unit D
- 9 Darby Field Common Unit E
- 9 Darby Field Common
- 9 Darby Field Common Unit A also 10A
- 9 Darby Field Common
- 9 Darby Field Common Unit B
- 9 Darby Field Common Unit E
- 7 Darby Field Common Unit D
- 7 Darby Field Common Unit B
- 1 Darby Field Common
- 601 Calef Hwy
- 12 Lee Hill Rd