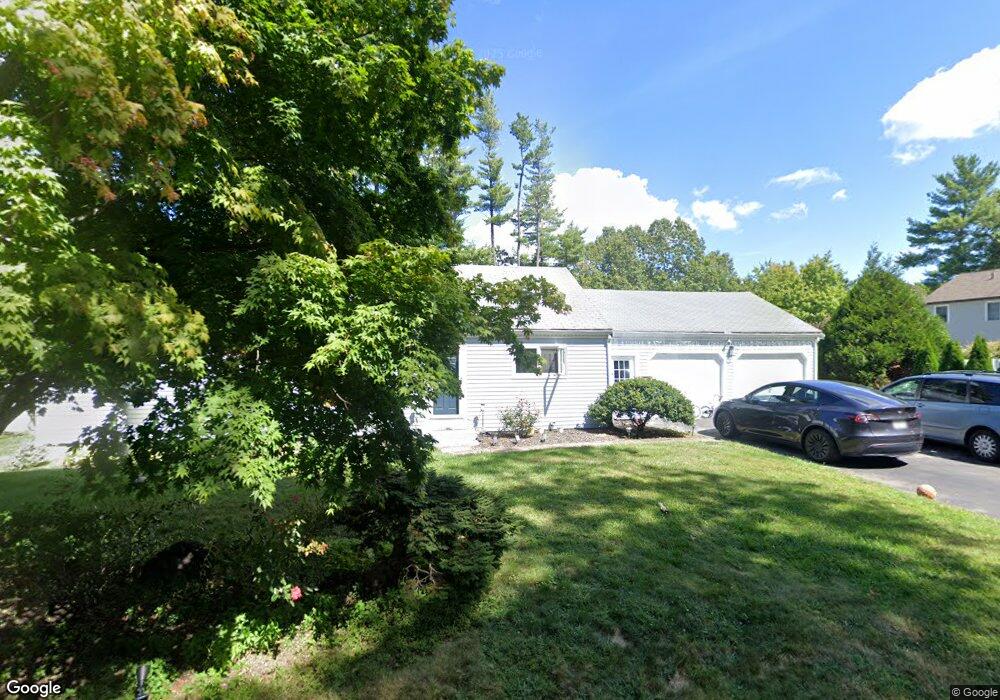
5 Peter Hobart Dr Hingham, MA 02043
South Hingham NeighborhoodEstimated Value: $831,000 - $962,000
3
Beds
2
Baths
1,432
Sq Ft
$633/Sq Ft
Est. Value
About This Home
This home is located at 5 Peter Hobart Dr, Hingham, MA 02043 and is currently estimated at $906,744, approximately $633 per square foot. 5 Peter Hobart Dr is a home located in Plymouth County with nearby schools including South Elementary School, Hingham Middle School, and Hingham High School.
Ownership History
Date
Name
Owned For
Owner Type
Purchase Details
Closed on
Sep 30, 2021
Sold by
Gatturna Marion P Est
Bought by
Kane Kristel and Kane Sentiana
Current Estimated Value
Home Financials for this Owner
Home Financials are based on the most recent Mortgage that was taken out on this home.
Original Mortgage
$608,000
Outstanding Balance
$554,439
Interest Rate
2.8%
Mortgage Type
Purchase Money Mortgage
Estimated Equity
$352,305
Purchase Details
Closed on
Sep 15, 1972
Bought by
Gatturna Robert A and Gatturna Marion P
Create a Home Valuation Report for This Property
The Home Valuation Report is an in-depth analysis detailing your home's value as well as a comparison with similar homes in the area
Home Values in the Area
Average Home Value in this Area
Purchase History
| Date | Buyer | Sale Price | Title Company |
|---|---|---|---|
| Kane Kristel | $760,000 | None Available | |
| Gatturna Robert A | $36,000 | -- |
Source: Public Records
Mortgage History
| Date | Status | Borrower | Loan Amount |
|---|---|---|---|
| Open | Kane Kristel | $608,000 | |
| Previous Owner | Gatturna Robert A | $36,000 |
Source: Public Records
Tax History
| Year | Tax Paid | Tax Assessment Tax Assessment Total Assessment is a certain percentage of the fair market value that is determined by local assessors to be the total taxable value of land and additions on the property. | Land | Improvement |
|---|---|---|---|---|
| 2025 | $7,943 | $743,000 | $451,300 | $291,700 |
| 2024 | $7,799 | $718,800 | $451,300 | $267,500 |
| 2023 | $7,122 | $712,200 | $451,300 | $260,900 |
| 2022 | $6,340 | $548,400 | $348,400 | $200,000 |
| 2021 | $6,279 | $532,100 | $348,400 | $183,700 |
| 2020 | $6,135 | $532,100 | $348,400 | $183,700 |
| 2019 | $6,162 | $521,800 | $348,400 | $173,400 |
| 2018 | $5,894 | $500,800 | $348,400 | $152,400 |
| 2017 | $6,196 | $505,800 | $353,400 | $152,400 |
| 2016 | $6,108 | $489,000 | $336,600 | $152,400 |
| 2015 | $5,927 | $473,000 | $320,600 | $152,400 |
Source: Public Records
Map
Nearby Homes
- 183 Gardner St
- 100 Whiting St
- 18 Whiting Ln
- 4 Kerri Ln
- 1 Kerri Ln
- 17 Pine Haven Cir
- 5 Old County Rd
- 18 Colby St
- 55 Turner Rd
- 22 Longmeadow Rd
- 8 Blueberry Ct
- 5 Blueberry Ct
- 214 Washington St Unit 24
- 214 Washington St Unit 28
- 1276 Washington St Unit A
- 17 Elizabeth Ln Unit 17
- 15 Elizabeth Ln Unit 15
- 13 Elizabeth Ln Unit 13
- 9 Elizabeth Ln Unit 9
- 7 Elizabeth Ln Unit 7
- 3 Peter Hobart Dr
- 12 Peter Hobart Dr
- 167 Whiting St
- 4 Peter Hobart Dr
- 173 Whiting St
- 9 Peter Hobart Dr
- 14 Peter Hobart Dr
- 155 Whiting St
- 6 Peter Hobart Dr
- 238 Gardner St
- 130 Whiting St
- 15 Peter Hobart Dr
- 16 Peter Hobart Dr
- 150 Whiting St
- 188 Whiting St Unit 102
- 244 Gardner St
- 153 Whiting St
- 17 Peter Hobart Dr
- 6 Derby St Unit 6
- 6 Derby St Unit WAY
Your Personal Tour Guide
Ask me questions while you tour the home.