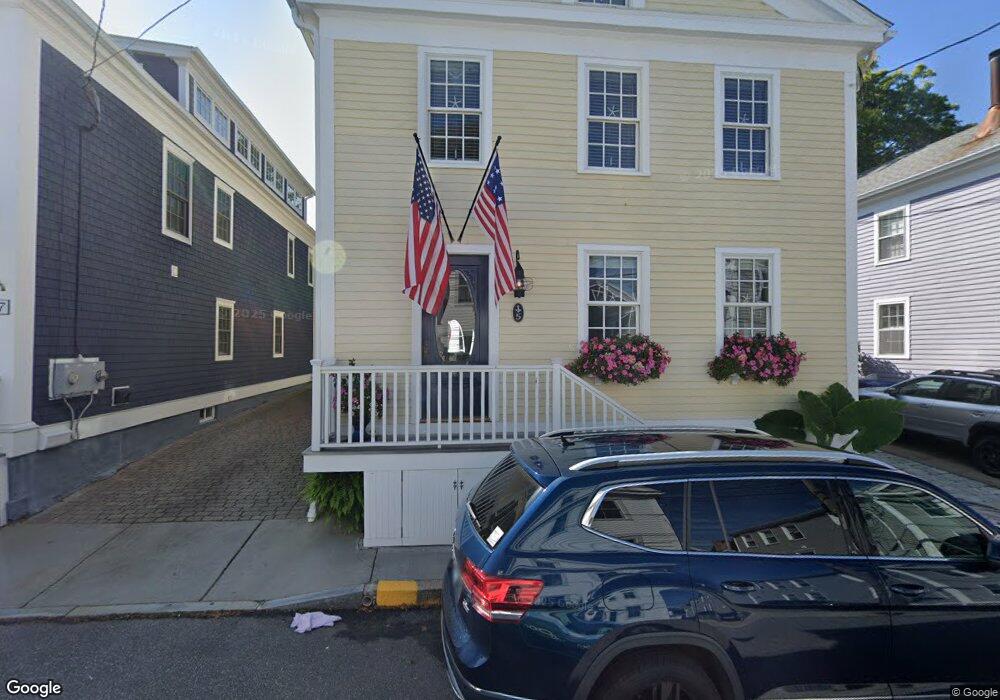
5 Trumbull St Stonington, CT 06378
Estimated Value: $1,014,469 - $1,237,000
3
Beds
2
Baths
2,208
Sq Ft
$516/Sq Ft
Est. Value
About This Home
This home is located at 5 Trumbull St, Stonington, CT 06378 and is currently estimated at $1,140,156, approximately $516 per square foot. 5 Trumbull St is a home located in New London County with nearby schools including Stonington Middle School, Stonington High School, and Pine Point School.
Ownership History
Date
Name
Owned For
Owner Type
Purchase Details
Closed on
Mar 5, 2018
Sold by
Rogers Kevin P and Rogers Susan B
Bought by
Rogers Kevin P and Lewis Jaime J
Current Estimated Value
Purchase Details
Closed on
Jun 30, 1999
Sold by
Brady Laurie
Bought by
Rogers Kevin P and Maynard Andrew M
Home Financials for this Owner
Home Financials are based on the most recent Mortgage that was taken out on this home.
Original Mortgage
$199,500
Interest Rate
7.19%
Mortgage Type
Purchase Money Mortgage
Create a Home Valuation Report for This Property
The Home Valuation Report is an in-depth analysis detailing your home's value as well as a comparison with similar homes in the area
Home Values in the Area
Average Home Value in this Area
Purchase History
| Date | Buyer | Sale Price | Title Company |
|---|---|---|---|
| Rogers Kevin P | -- | -- | |
| Rogers Kevin P | -- | -- | |
| Rogers Kevin P | $210,000 | -- | |
| Rogers Kevin P | $210,000 | -- |
Source: Public Records
Mortgage History
| Date | Status | Borrower | Loan Amount |
|---|---|---|---|
| Previous Owner | Rogers Kevin P | $50,000 | |
| Previous Owner | Rogers Kevin P | $225,000 | |
| Previous Owner | Rogers Kevin P | $199,500 |
Source: Public Records
Tax History Compared to Growth
Tax History
| Year | Tax Paid | Tax Assessment Tax Assessment Total Assessment is a certain percentage of the fair market value that is determined by local assessors to be the total taxable value of land and additions on the property. | Land | Improvement |
|---|---|---|---|---|
| 2025 | $11,793 | $579,700 | $331,100 | $248,600 |
| 2024 | $11,304 | $579,700 | $331,100 | $248,600 |
| 2023 | $11,391 | $579,700 | $331,100 | $248,600 |
| 2022 | $9,702 | $363,900 | $189,000 | $174,900 |
| 2021 | $9,771 | $363,900 | $189,000 | $174,900 |
| 2020 | $9,592 | $363,900 | $189,000 | $174,900 |
| 2019 | $9,463 | $359,000 | $189,000 | $170,000 |
| 2018 | $8,861 | $346,400 | $189,000 | $157,400 |
| 2017 | $7,573 | $293,200 | $163,800 | $129,400 |
| 2016 | $7,362 | $293,200 | $163,800 | $129,400 |
| 2015 | $7,043 | $293,200 | $163,800 | $129,400 |
| 2014 | $6,723 | $293,200 | $163,800 | $129,400 |
Source: Public Records
Map
Nearby Homes