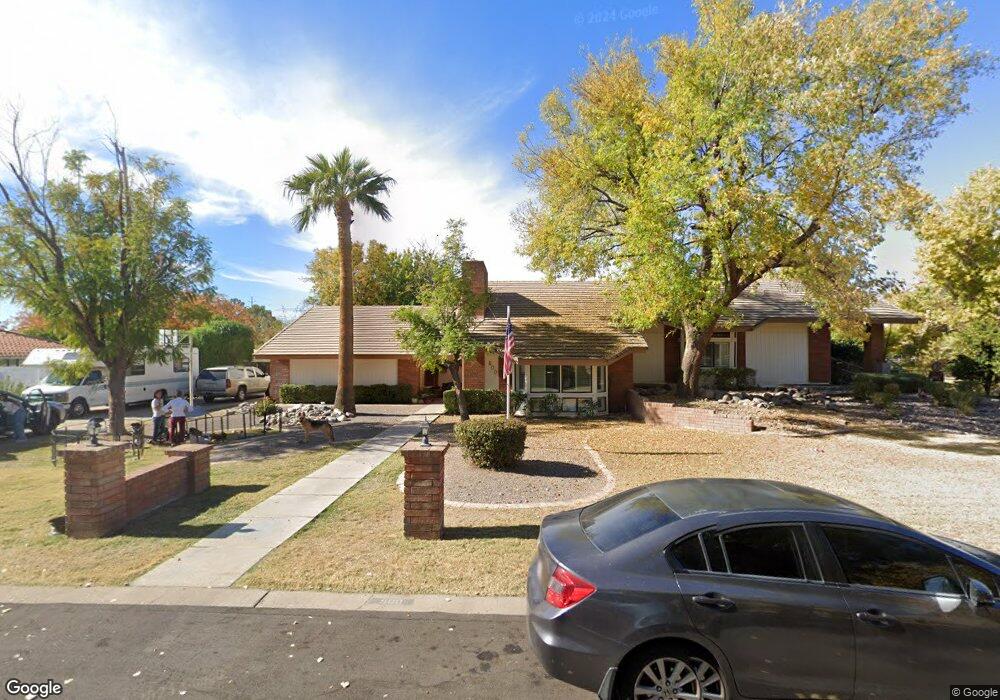
500 N 158th St Gilbert, AZ 85234
Val Vista NeighborhoodEstimated Value: $1,310,812 - $1,420,000
--
Bed
5
Baths
3,231
Sq Ft
$425/Sq Ft
Est. Value
About This Home
This home is located at 500 N 158th St, Gilbert, AZ 85234 and is currently estimated at $1,372,604, approximately $424 per square foot. 500 N 158th St is a home located in Maricopa County with nearby schools including Sonoma Ranch Elementary School, Greenfield Junior High School, and Gilbert Arts Academy.
Ownership History
Date
Name
Owned For
Owner Type
Purchase Details
Closed on
Feb 17, 2017
Sold by
Hansen Kimberly and Burleson Kim
Bought by
Hansen Kimberly and Hansen Todd
Current Estimated Value
Home Financials for this Owner
Home Financials are based on the most recent Mortgage that was taken out on this home.
Original Mortgage
$424,100
Outstanding Balance
$350,348
Interest Rate
4.12%
Mortgage Type
New Conventional
Estimated Equity
$1,022,256
Purchase Details
Closed on
Jan 24, 2017
Sold by
Hansen Kim
Bought by
Hansen Todd and Hansen Kim
Home Financials for this Owner
Home Financials are based on the most recent Mortgage that was taken out on this home.
Original Mortgage
$424,100
Outstanding Balance
$350,348
Interest Rate
4.12%
Mortgage Type
New Conventional
Estimated Equity
$1,022,256
Purchase Details
Closed on
Jan 26, 2010
Sold by
Burleson Ronald J
Bought by
Burleson Kim
Purchase Details
Closed on
May 25, 2004
Sold by
Burleson Ronald J
Bought by
Burleson Ronald J and Burleson Kimberly G
Home Financials for this Owner
Home Financials are based on the most recent Mortgage that was taken out on this home.
Original Mortgage
$488,750
Interest Rate
5.92%
Mortgage Type
New Conventional
Purchase Details
Closed on
Jan 17, 2002
Sold by
Burleson Kimberly G
Bought by
Burleson Ronald J
Home Financials for this Owner
Home Financials are based on the most recent Mortgage that was taken out on this home.
Original Mortgage
$440,000
Interest Rate
6.75%
Purchase Details
Closed on
Jun 5, 2000
Sold by
Burleson Ron J and Burleson Kim G
Bought by
Burleson Ron J and Burleson Kimberly G
Home Financials for this Owner
Home Financials are based on the most recent Mortgage that was taken out on this home.
Original Mortgage
$308,000
Interest Rate
7.87%
Purchase Details
Closed on
Feb 19, 1997
Sold by
Burleson Ron J and Burleson Ronald J
Bought by
Burleson Ron J and Burleson Kim G
Purchase Details
Closed on
Apr 11, 1996
Sold by
Burleson Ron J and Burleson Kim G
Bought by
Burleson Ron J and Burleson Ronald J
Home Financials for this Owner
Home Financials are based on the most recent Mortgage that was taken out on this home.
Original Mortgage
$250,000
Interest Rate
7.87%
Purchase Details
Closed on
May 19, 1994
Sold by
Turley W Alan and Turley Millicent H
Bought by
Burleson Ron J and Burleson Kimberly G
Home Financials for this Owner
Home Financials are based on the most recent Mortgage that was taken out on this home.
Original Mortgage
$250,650
Interest Rate
6.37%
Mortgage Type
New Conventional
Create a Home Valuation Report for This Property
The Home Valuation Report is an in-depth analysis detailing your home's value as well as a comparison with similar homes in the area
Home Values in the Area
Average Home Value in this Area
Purchase History
| Date | Buyer | Sale Price | Title Company |
|---|---|---|---|
| Hansen Kimberly | -- | Security Title Agency Inc | |
| Hansen Todd | -- | None Available | |
| Burleson Kim | -- | Accommodation | |
| Burleson Kim | -- | Accommodation | |
| Burleson Ronald J | -- | Transnation Title | |
| Burleson Ronald J | -- | Security Title Agency | |
| Burleson Ron J | -- | Ati Title Agency | |
| Burleson Ron J | -- | -- | |
| Burleson Ron J | -- | Chicago Title Insurance Co | |
| Burleson Ron J | $278,500 | Security Title Agency |
Source: Public Records
Mortgage History
| Date | Status | Borrower | Loan Amount |
|---|---|---|---|
| Open | Hansen Kimberly | $424,100 | |
| Closed | Burleson Ronald J | $488,750 | |
| Previous Owner | Burleson Ronald J | $440,000 | |
| Previous Owner | Burleson Ron J | $308,000 | |
| Previous Owner | Burleson Ron J | $250,000 | |
| Previous Owner | Burleson Ron J | $250,650 |
Source: Public Records
Tax History Compared to Growth
Tax History
| Year | Tax Paid | Tax Assessment Tax Assessment Total Assessment is a certain percentage of the fair market value that is determined by local assessors to be the total taxable value of land and additions on the property. | Land | Improvement |
|---|---|---|---|---|
| 2025 | $4,926 | $60,863 | -- | -- |
| 2024 | $4,750 | $57,964 | -- | -- |
| 2023 | $4,750 | $90,060 | $18,010 | $72,050 |
| 2022 | $4,603 | $66,520 | $13,300 | $53,220 |
| 2021 | $4,781 | $63,830 | $12,760 | $51,070 |
| 2020 | $4,702 | $61,260 | $12,250 | $49,010 |
| 2019 | $4,325 | $56,560 | $11,310 | $45,250 |
| 2018 | $4,190 | $53,570 | $10,710 | $42,860 |
| 2017 | $4,033 | $55,100 | $11,020 | $44,080 |
| 2016 | $4,150 | $54,910 | $10,980 | $43,930 |
| 2015 | $3,731 | $50,330 | $10,060 | $40,270 |
Source: Public Records
Map
Nearby Homes
- 781 N Bristol Ln
- 290 N Portland Ave
- 2041 E Marquette Dr
- 1911 E Bruce Ave
- 2558 E Page Ct
- 811 N Poinciana Ct Unit 10
- 1699 E Hearne Way
- 1831 E Linda Ln
- 1034 N Sea Haven Ct
- 1644 E Laurel Ave
- 2090 E Finley St
- 2310 E Mallard Ct
- 2333 E Egret Ct
- 2042 E Victor Rd
- 2119 E New Bedford Dr
- 1834 E Willow Tree Ct
- 1538 E Laurel Ave
- 1754 E Cotton Ct
- 1510 E Campbell Ave
- 2069 E Sierra Madre Ave
- 520 N 158th St
- 480 N 158th St
- 19000 S 165th Lot 3 Way
- 9801 S 157th Place
- 2268 E Chapala St
- 9633 S 157th Place
- 15844 E Chapala St
- 540 N 158th St
- 450 N 158th St
- 9823 S 157th Place
- 2265 E Redfield Rd
- 2257 E Chapala St
- 2288 E Chapala St
- 0 S 158th St Unit 2 2906175
- 2277 E Chapala St
- 9619 S 157th Place
- 564 N 158th St
- 564 S 158th St
- 2285 E Redfield Rd
- 15716 E Chapala St