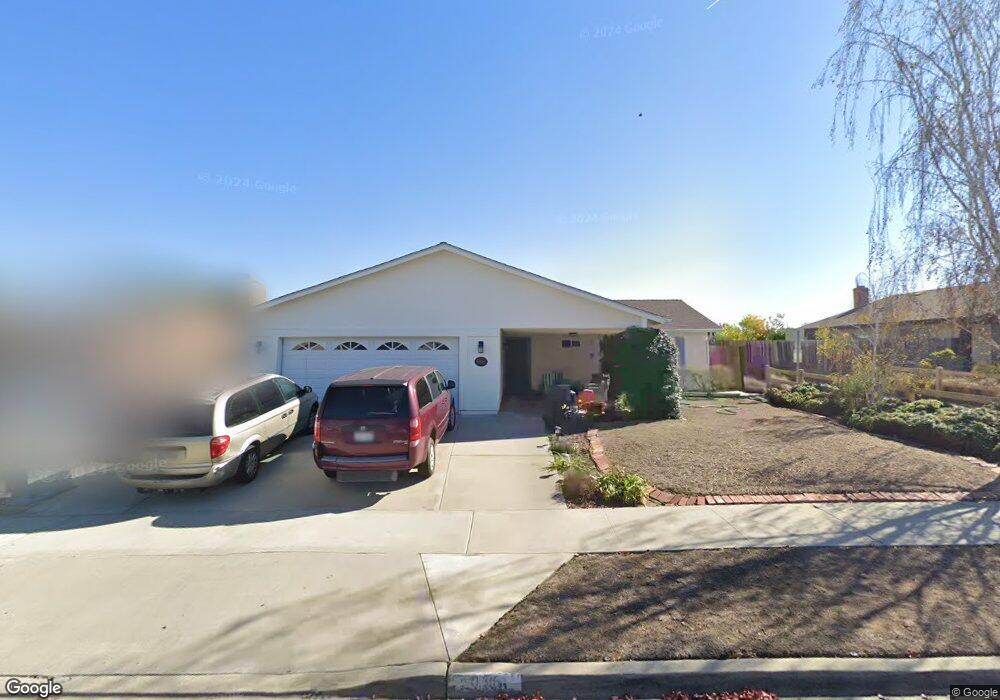
5036 Tyler St Oceanside, CA 92057
Guajome NeighborhoodEstimated Value: $727,000 - $825,000
3
Beds
2
Baths
1,372
Sq Ft
$565/Sq Ft
Est. Value
About This Home
This home is located at 5036 Tyler St, Oceanside, CA 92057 and is currently estimated at $775,168, approximately $564 per square foot. 5036 Tyler St is a home located in San Diego County with nearby schools including Del Rio Elementary School, Cesar Chavez Middle School, and El Camino High School.
Ownership History
Date
Name
Owned For
Owner Type
Purchase Details
Closed on
Jun 11, 2020
Sold by
Eberlein Mark and Eberlein Julie L
Bought by
Eberlein Mark and Eberlein Julie L
Current Estimated Value
Purchase Details
Closed on
Feb 11, 2000
Sold by
Kang Hyung Shin
Bought by
Eberlein Mark and Eberlein Julie L
Home Financials for this Owner
Home Financials are based on the most recent Mortgage that was taken out on this home.
Original Mortgage
$184,885
Outstanding Balance
$61,118
Interest Rate
8.16%
Mortgage Type
VA
Estimated Equity
$714,050
Purchase Details
Closed on
Jun 21, 1999
Sold by
Jacobsen Thomas P and Jacobsen Gricelda
Bought by
Kang Hyung Shin
Purchase Details
Closed on
Jul 23, 1996
Sold by
Jacobsen Thomas P
Bought by
Jacobsen Thomas P and Jacobsen Gricelda
Home Financials for this Owner
Home Financials are based on the most recent Mortgage that was taken out on this home.
Original Mortgage
$144,848
Interest Rate
8.1%
Mortgage Type
VA
Purchase Details
Closed on
Apr 19, 1993
Purchase Details
Closed on
Jun 14, 1983
Create a Home Valuation Report for This Property
The Home Valuation Report is an in-depth analysis detailing your home's value as well as a comparison with similar homes in the area
Home Values in the Area
Average Home Value in this Area
Purchase History
| Date | Buyer | Sale Price | Title Company |
|---|---|---|---|
| Eberlein Mark | -- | None Available | |
| Eberlein Mark | -- | None Available | |
| Eberlein Mark | $179,500 | Commonwealth Land Title Co | |
| Kang Hyung Shin | $132,500 | -- | |
| Jacobsen Thomas P | -- | Commonwealth Land Title Ins | |
| Jacobsen Thomas P | -- | Commonwealth Land Title Ins | |
| -- | $142,900 | -- | |
| -- | $94,700 | -- |
Source: Public Records
Mortgage History
| Date | Status | Borrower | Loan Amount |
|---|---|---|---|
| Open | Eberlein Mark | $184,885 | |
| Previous Owner | Jacobsen Thomas P | $144,848 |
Source: Public Records
Tax History
| Year | Tax Paid | Tax Assessment Tax Assessment Total Assessment is a certain percentage of the fair market value that is determined by local assessors to be the total taxable value of land and additions on the property. | Land | Improvement |
|---|---|---|---|---|
| 2025 | $2,997 | $275,858 | $114,281 | $161,577 |
| 2024 | $2,997 | $270,450 | $112,041 | $158,409 |
| 2023 | $2,903 | $265,148 | $109,845 | $155,303 |
| 2022 | $2,858 | $259,950 | $107,692 | $152,258 |
| 2021 | $2,867 | $254,854 | $105,581 | $149,273 |
| 2020 | $2,779 | $252,242 | $104,499 | $147,743 |
| 2019 | $2,697 | $247,297 | $102,450 | $144,847 |
| 2018 | $2,667 | $242,449 | $100,442 | $142,007 |
| 2017 | $71 | $237,696 | $98,473 | $139,223 |
| 2016 | $2,531 | $233,037 | $96,543 | $136,494 |
| 2015 | $2,456 | $229,537 | $95,093 | $134,444 |
| 2014 | $2,361 | $225,042 | $93,231 | $131,811 |
Source: Public Records
Map
Nearby Homes
- 166 Mckinley St
- 5108 Andrew Jackson St
- 209 Madison St
- 154 Harrison St
- 5462 Mae Way
- 5462 Giovanni Way
- 5322 Leon St
- 104 Mellano Way
- 150 N River Cir Unit 105
- 125 Mellano Way
- 119 Takamasa Way
- 110 Takamasa Way
- 131 Mellano Way
- 111 Metz Way
- 130 Mellano Way
- 107 Metz Way
- 5074 Cascade Way Unit 102
- 5516 Giovanni Way
- 114 Metz Way
- 116 Metz Way
Your Personal Tour Guide
Ask me questions while you tour the home.