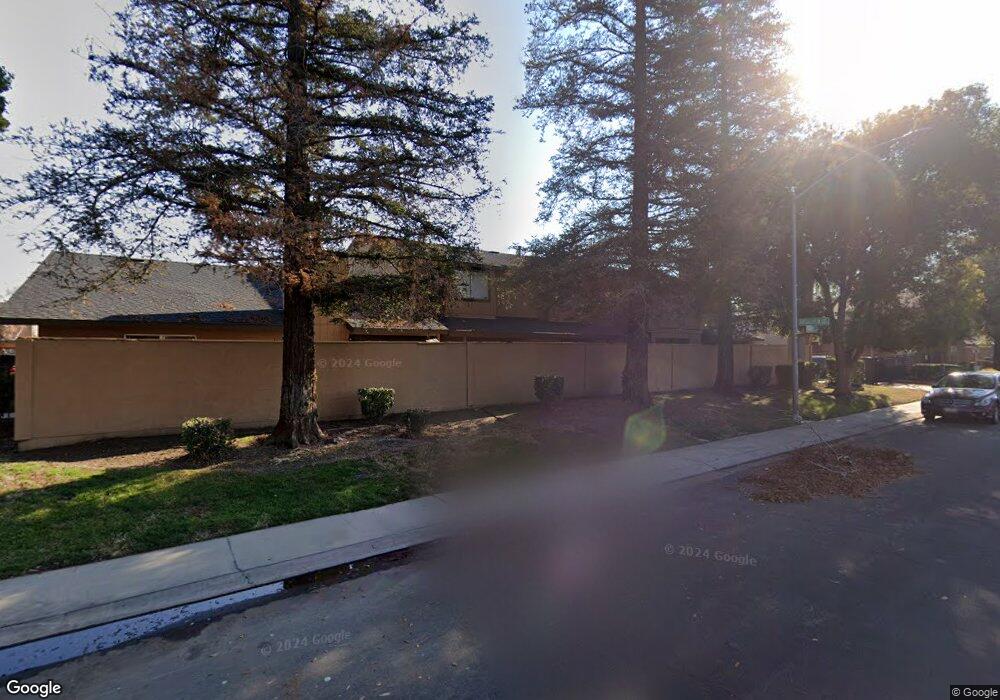
512 Pirinen Ln Unit C Modesto, CA 95354
La Loma NeighborhoodEstimated Value: $206,697 - $263,000
2
Beds
1
Bath
1,079
Sq Ft
$215/Sq Ft
Est. Value
About This Home
This home is located at 512 Pirinen Ln Unit C, Modesto, CA 95354 and is currently estimated at $231,924, approximately $214 per square foot. 512 Pirinen Ln Unit C is a home located in Stanislaus County with nearby schools including Capistrano Elementary, Norman N. Glick Middle School, and Peter Johansen High School.
Ownership History
Date
Name
Owned For
Owner Type
Purchase Details
Closed on
Aug 7, 2009
Sold by
Bank Of America National Association
Bought by
Clark Sarah
Current Estimated Value
Home Financials for this Owner
Home Financials are based on the most recent Mortgage that was taken out on this home.
Original Mortgage
$30,000
Interest Rate
5.19%
Mortgage Type
New Conventional
Purchase Details
Closed on
Nov 5, 2005
Sold by
The Villas At Creekside Llc
Bought by
Castro Toni
Home Financials for this Owner
Home Financials are based on the most recent Mortgage that was taken out on this home.
Original Mortgage
$163,960
Interest Rate
5.87%
Mortgage Type
Purchase Money Mortgage
Purchase Details
Closed on
Jun 11, 2003
Sold by
Castro Toni
Bought by
Bank Of America National Association
Create a Home Valuation Report for This Property
The Home Valuation Report is an in-depth analysis detailing your home's value as well as a comparison with similar homes in the area
Home Values in the Area
Average Home Value in this Area
Purchase History
| Date | Buyer | Sale Price | Title Company |
|---|---|---|---|
| Clark Sarah | $48,000 | First American Title Company | |
| Castro Toni | $205,000 | Alliance Title Company | |
| Bank Of America National Association | $50,000 | Accommodation |
Source: Public Records
Mortgage History
| Date | Status | Borrower | Loan Amount |
|---|---|---|---|
| Closed | Clark Sarah | $30,000 | |
| Previous Owner | Castro Toni | $163,960 |
Source: Public Records
Tax History
| Year | Tax Paid | Tax Assessment Tax Assessment Total Assessment is a certain percentage of the fair market value that is determined by local assessors to be the total taxable value of land and additions on the property. | Land | Improvement |
|---|---|---|---|---|
| 2025 | $670 | $61,944 | $25,809 | $36,135 |
| 2024 | $657 | $60,730 | $25,303 | $35,427 |
| 2023 | $742 | $59,540 | $24,807 | $34,733 |
| 2022 | $686 | $58,373 | $24,321 | $34,052 |
| 2021 | $700 | $57,230 | $23,845 | $33,385 |
| 2020 | $690 | $56,644 | $23,601 | $33,043 |
| 2019 | $677 | $55,535 | $23,139 | $32,396 |
| 2018 | $667 | $54,447 | $22,686 | $31,761 |
| 2017 | $652 | $53,381 | $22,242 | $31,139 |
| 2016 | $639 | $52,335 | $21,806 | $30,529 |
| 2015 | $630 | $51,550 | $21,479 | $30,071 |
| 2014 | $618 | $50,541 | $21,059 | $29,482 |
Source: Public Records
Map
Nearby Homes
- 536 Capistrano Dr
- 604 Fort Sumpter Dr
- 2728 El Pasado Dr
- 2756 Barcelona Dr
- 617 Merrimac Ct
- 2800 Bateman Ln
- 300 Los Verdes Ct
- 405 San Andreas Ct
- 3117 Gibson Way
- 301 Goldrun Dr
- 417 Mid Pines Way
- 3424 Penny Ln
- 2644 San Ignacio Ave
- 200 Dorita Way
- 209 Goldrun Dr
- 608 N Mcclure Rd
- 405 Melbourne Dr
- 220 Kingston Ln
- 216 Kingston Ln
- 2500 Haddon Ave
- 512 Pirinen Ln Unit E
- 512 Pirinen Ln Unit A
- 512 Pirinen Ln Unit D
- 512 Pirinen Ln
- 512 Pirinen Ln Unit B
- 520 Pirinen Ln
- 520 Pirinen Ln Unit E
- 520 Pirinen Ln Unit F
- 520 Pirinen Ln Unit D
- 520 Pirinen Ln Unit C
- 520 Pirinen Ln Unit B
- 520 Pirinen Ln Unit A
- 517 Pirinen Ln
- 525 Pirinen Ln
- 509 Pirinen Ln
- 2841 Andalusia Way
- 517 Lincoln Ave
- 517 Lincoln Ave Unit E
- 517 Lincoln Ave Unit A
- 517 Lincoln Ave Unit B
Your Personal Tour Guide
Ask me questions while you tour the home.