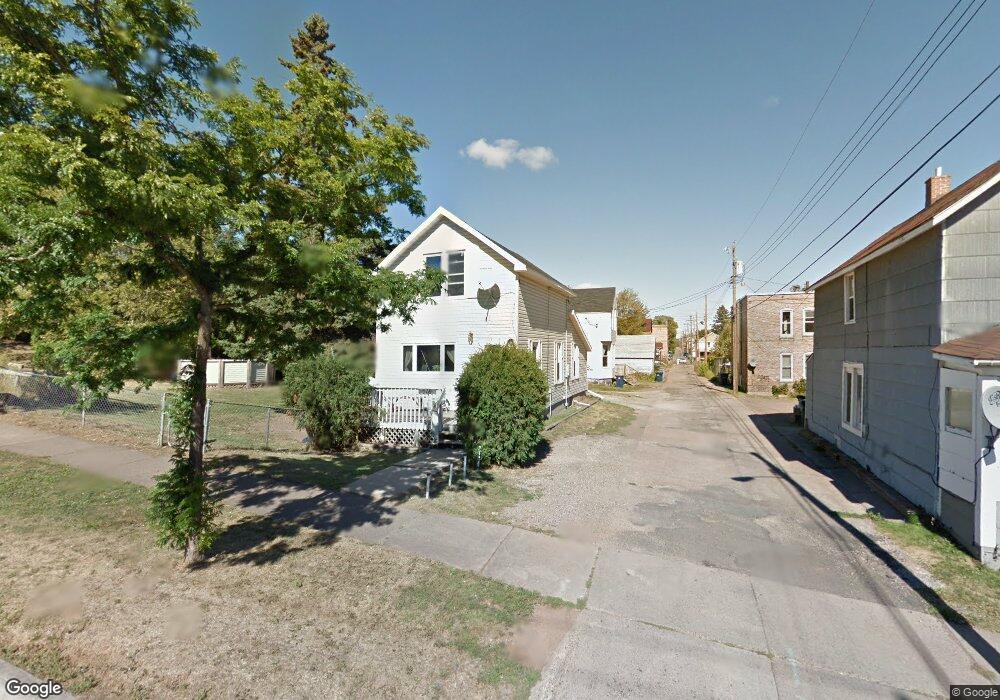
518 N 3rd Ave E Duluth, MN 55805
Central Hillside NeighborhoodEstimated Value: $198,000 - $241,000
3
Beds
1
Bath
1,136
Sq Ft
$192/Sq Ft
Est. Value
About This Home
This home is located at 518 N 3rd Ave E, Duluth, MN 55805 and is currently estimated at $218,369, approximately $192 per square foot. 518 N 3rd Ave E is a home located in St. Louis County with nearby schools including Myers-Wilkins Elementary, Lincoln Park Middle School, and Denfeld High School.
Ownership History
Date
Name
Owned For
Owner Type
Purchase Details
Closed on
Mar 28, 2018
Sold by
Tjaden Nora J and Mahlberg Nora J
Bought by
Mahlberg David M
Current Estimated Value
Purchase Details
Closed on
Dec 5, 2002
Sold by
Mahlberg David M and Mahlberg Nora J
Bought by
Mahlberg David M and Mahlberg Nora J
Home Financials for this Owner
Home Financials are based on the most recent Mortgage that was taken out on this home.
Original Mortgage
$73,300
Interest Rate
7.65%
Create a Home Valuation Report for This Property
The Home Valuation Report is an in-depth analysis detailing your home's value as well as a comparison with similar homes in the area
Home Values in the Area
Average Home Value in this Area
Purchase History
| Date | Buyer | Sale Price | Title Company |
|---|---|---|---|
| Mahlberg David M | -- | None Available | |
| Mahlberg David M | -- | Ati Title Company |
Source: Public Records
Mortgage History
| Date | Status | Borrower | Loan Amount |
|---|---|---|---|
| Previous Owner | Mahlberg David M | $73,300 |
Source: Public Records
Tax History
| Year | Tax Paid | Tax Assessment Tax Assessment Total Assessment is a certain percentage of the fair market value that is determined by local assessors to be the total taxable value of land and additions on the property. | Land | Improvement |
|---|---|---|---|---|
| 2024 | $2,222 | $187,100 | $24,500 | $162,600 |
| 2023 | $2,222 | $166,800 | $29,200 | $137,600 |
| 2022 | $2,316 | $153,400 | $27,000 | $126,400 |
| 2021 | $1,266 | $118,000 | $25,000 | $93,000 |
| 2020 | $1,608 | $101,600 | $21,600 | $80,000 |
| 2019 | $1,590 | $92,600 | $19,600 | $73,000 |
| 2018 | $1,378 | $92,600 | $19,600 | $73,000 |
| 2017 | $1,286 | $91,500 | $19,600 | $71,900 |
| 2016 | $708 | $82,000 | $4,800 | $77,200 |
| 2015 | $715 | $42,300 | $6,000 | $36,300 |
| 2014 | $715 | $42,300 | $6,000 | $36,300 |
Source: Public Records
Map
Nearby Homes
- 609 N 4th Ave E
- 409 E 6th St
- 202 E 7th St Unit D
- 517 E 5th St
- 523 N 1st Ave E
- 311 E Superior St Unit 704
- 311 E Superior St Unit 905
- 311 E Superior St
- 1126 Mesaba Ave Unit 119
- 722 E 3rd St
- 706 E 11th St
- 701 E 11th St
- XXX E 13th St
- 1125 N 7th Ave E
- 1023 E 5th St
- XXX E Ninth St
- 1027 E 9th St
- 902 N 11th Ave E
- 1205 E 3rd St
- 1011 N 12th Ave E
Your Personal Tour Guide
Ask me questions while you tour the home.