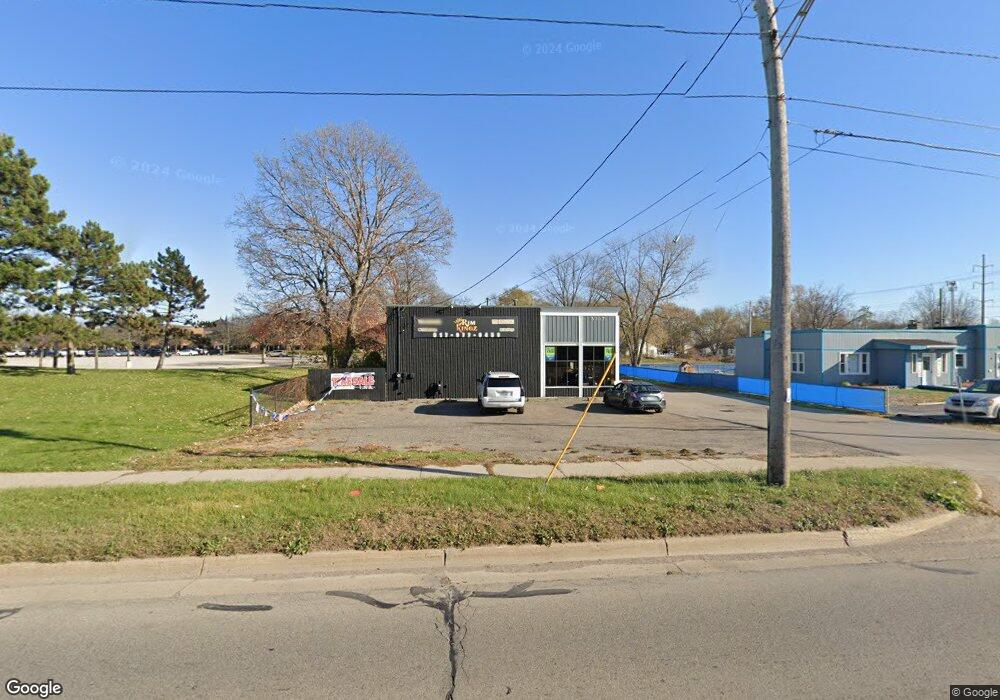
5317 S Cedar St Lansing, MI 48911
Southern Lansing NeighborhoodEstimated Value: $213,143
--
Bed
--
Bath
2,946
Sq Ft
$72/Sq Ft
Est. Value
About This Home
This home is located at 5317 S Cedar St, Lansing, MI 48911 and is currently estimated at $213,143, approximately $72 per square foot. 5317 S Cedar St is a home located in Ingham County with nearby schools including Kendon School, Attwood School, and Everett High School.
Ownership History
Date
Name
Owned For
Owner Type
Purchase Details
Closed on
Dec 11, 2024
Sold by
Anlv Properties Llc
Bought by
Second Investors Llc
Current Estimated Value
Purchase Details
Closed on
Apr 14, 2021
Sold by
Khan Fathima
Bought by
Anlv Properties Llc
Purchase Details
Closed on
Jun 24, 2015
Sold by
Bayview Loan Servicing Llc
Bought by
Khan Fathima
Purchase Details
Closed on
Feb 28, 2013
Sold by
Venner Ronlad L
Bought by
Bayview Loan Servicing Llc
Create a Home Valuation Report for This Property
The Home Valuation Report is an in-depth analysis detailing your home's value as well as a comparison with similar homes in the area
Home Values in the Area
Average Home Value in this Area
Purchase History
| Date | Buyer | Sale Price | Title Company |
|---|---|---|---|
| Second Investors Llc | $200,000 | Bell Title | |
| Anlv Properties Llc | $245,000 | Bell Title | |
| Anlv Properties Llc | -- | None Available | |
| Khan Fathima | $89,000 | None Available | |
| Bayview Loan Servicing Llc | $1,276,000 | None Available |
Source: Public Records
Mortgage History
| Date | Status | Borrower | Loan Amount |
|---|---|---|---|
| Closed | Anlv Properties Llc | $0 |
Source: Public Records
Tax History Compared to Growth
Tax History
| Year | Tax Paid | Tax Assessment Tax Assessment Total Assessment is a certain percentage of the fair market value that is determined by local assessors to be the total taxable value of land and additions on the property. | Land | Improvement |
|---|---|---|---|---|
| 2025 | $11,989 | $158,400 | $86,100 | $72,300 |
| 2024 | $104 | $149,000 | $86,100 | $62,900 |
| 2023 | $11,264 | $160,000 | $98,400 | $61,600 |
| 2022 | $10,252 | $134,500 | $74,000 | $60,500 |
| 2021 | $10,034 | $132,900 | $74,000 | $58,900 |
| 2020 | $9,969 | $131,500 | $74,000 | $57,500 |
| 2019 | $9,679 | $126,300 | $74,000 | $52,300 |
| 2018 | $9,294 | $124,100 | $74,000 | $50,100 |
| 2017 | $9,036 | $124,100 | $74,000 | $50,100 |
| 2016 | $10,880 | $122,900 | $74,000 | $48,900 |
| 2015 | $10,880 | $158,300 | $147,998 | $10,302 |
| 2014 | $10,880 | $151,500 | $147,998 | $3,502 |
Source: Public Records
Map
Nearby Homes
- 129 Village Dr
- 4922 Southgate Ave
- 5011 Stafford Ave
- 5724 Orchard Ct
- 201 E Syringa Dr
- 5727 Annapolis Dr
- 5751 Joshua St
- 5750 Orchard Ct
- 5808 Orchard Ct
- 5636 Ellendale Dr
- 105 Cox Blvd
- 1101 Barr Ave
- 4800 Ora St
- 111 E Potter Ave
- 4719 S Pennsylvania Ave
- 4317 S Cedar St
- 629 Emily Ave
- 522 E Cavanaugh Rd
- 600 E Cavanaugh Rd
- 6029 Ellendale Dr
- 5325 S Cedar St
- 531 Armstrong Rd
- 537 Armstrong Rd
- 543 Armstrong Rd
- 5312 S Cedar St
- 530 Armstrong Rd
- 547 Armstrong Rd
- 536 Armstrong Rd
- 551 Armstrong Rd
- 540 Armstrong Rd
- 559 Armstrong Rd
- 546 Armstrong Rd
- 552 Armstrong Rd
- 558 Armstrong Rd
- 565 Armstrong Rd
- 564 Armstrong Rd
- 569 Armstrong Rd
- 5436 S Cedar St
- 5215 Jolly Cedar Ct
- 575 Armstrong Rd