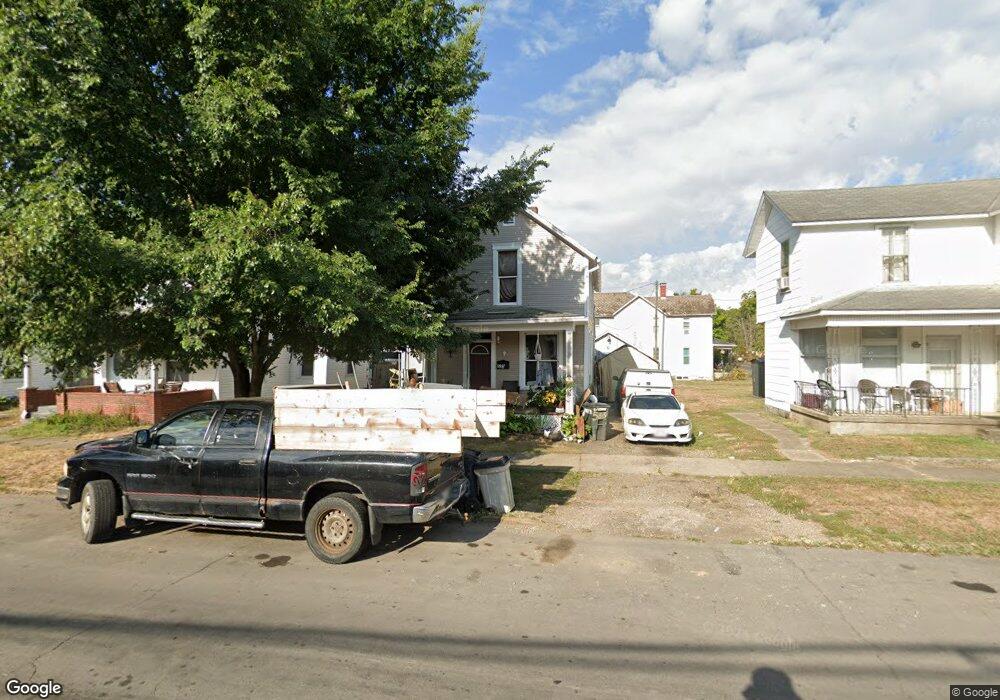
533 N Maple St Lancaster, OH 43130
Estimated Value: $140,000 - $188,000
2
Beds
1
Bath
1,256
Sq Ft
$133/Sq Ft
Est. Value
About This Home
This home is located at 533 N Maple St, Lancaster, OH 43130 and is currently estimated at $167,292, approximately $133 per square foot. 533 N Maple St is a home located in Fairfield County with nearby schools including Thomas Ewing Junior High School, Lancaster High School, and St Mary Elementary School.
Ownership History
Date
Name
Owned For
Owner Type
Purchase Details
Closed on
Apr 21, 2006
Sold by
Federal Home Loan Mortgage Corporation
Current Estimated Value
Home Financials for this Owner
Home Financials are based on the most recent Mortgage that was taken out on this home.
Original Mortgage
$65,450
Outstanding Balance
$1,453
Interest Rate
6.54%
Mortgage Type
Purchase Money Mortgage
Estimated Equity
$165,839
Purchase Details
Closed on
Jul 7, 2005
Sold by
Saunders Phyllis C and Mortgage Electronic Registrati
Bought by
Federal Home Loan Mortgage Corporation
Create a Home Valuation Report for This Property
The Home Valuation Report is an in-depth analysis detailing your home's value as well as a comparison with similar homes in the area
Home Values in the Area
Average Home Value in this Area
Purchase History
| Date | Buyer | Sale Price | Title Company |
|---|---|---|---|
| -- | $77,000 | None Available | |
| Federal Home Loan Mortgage Corporation | $56,000 | -- |
Source: Public Records
Mortgage History
| Date | Status | Borrower | Loan Amount |
|---|---|---|---|
| Open | Canamerican Real Estate Llc | $65,450 |
Source: Public Records
Tax History
| Year | Tax Paid | Tax Assessment Tax Assessment Total Assessment is a certain percentage of the fair market value that is determined by local assessors to be the total taxable value of land and additions on the property. | Land | Improvement |
|---|---|---|---|---|
| 2025 | $3,572 | $51,440 | $16,240 | $35,200 |
| 2024 | $3,572 | $39,730 | $8,460 | $31,270 |
| 2023 | $1,476 | $39,730 | $8,460 | $31,270 |
| 2022 | $1,485 | $39,730 | $8,460 | $31,270 |
| 2021 | $1,291 | $32,370 | $8,460 | $23,910 |
| 2020 | $1,238 | $32,370 | $8,460 | $23,910 |
| 2019 | $1,179 | $32,370 | $8,460 | $23,910 |
| 2018 | $814 | $25,040 | $8,460 | $16,580 |
| 2017 | $814 | $21,220 | $7,970 | $13,250 |
| 2016 | $794 | $21,220 | $7,970 | $13,250 |
| 2015 | $796 | $20,650 | $7,970 | $12,680 |
| 2014 | $759 | $20,650 | $7,970 | $12,680 |
| 2013 | $759 | $20,650 | $7,970 | $12,680 |
Source: Public Records
Map
Nearby Homes
- 517 N Maple St
- 233 E 6th Ave
- 311 E Allen St
- 547 E Mulberry St
- 600 N High St
- 641 King St
- 621 E Mulberry St
- 249 N Pearl Ave
- 534 E Wheeling St
- 705 Madison Ave
- 545 E Main St
- 165 Lake St
- 736 E Allen St
- 515 E Chestnut St
- 632 N Eastwood Ave
- 820 N Broad St
- 342 E Chestnut St
- 154 E Main St
- 810 N Eastwood Ave
- 123 Arnold Ave
Your Personal Tour Guide
Ask me questions while you tour the home.