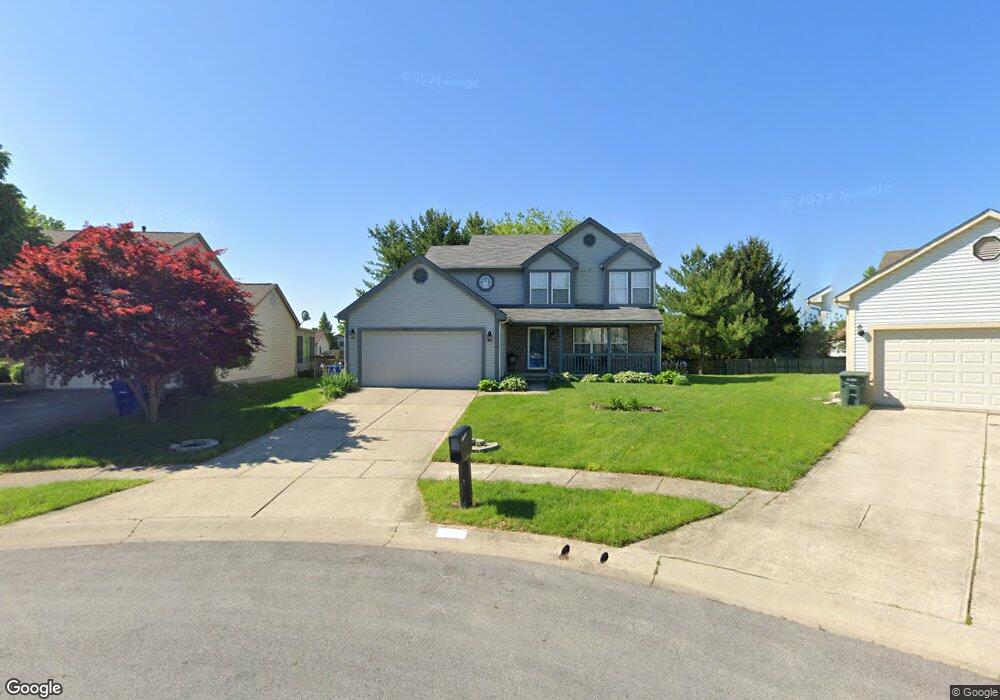
5339 Mendon Ct Columbus, OH 43232
Walnut Heights NeighborhoodEstimated Value: $261,511 - $310,000
4
Beds
3
Baths
1,734
Sq Ft
$168/Sq Ft
Est. Value
About This Home
This home is located at 5339 Mendon Ct, Columbus, OH 43232 and is currently estimated at $291,628, approximately $168 per square foot. 5339 Mendon Ct is a home located in Franklin County with nearby schools including Liberty Elementary School, Yorktown Middle School, and Independence High School.
Ownership History
Date
Name
Owned For
Owner Type
Purchase Details
Closed on
Sep 29, 2006
Sold by
Harton Gwendolyn D and Harton Decole M
Bought by
Jackson Theresa
Current Estimated Value
Home Financials for this Owner
Home Financials are based on the most recent Mortgage that was taken out on this home.
Original Mortgage
$138,500
Outstanding Balance
$82,783
Interest Rate
6.49%
Mortgage Type
Purchase Money Mortgage
Estimated Equity
$208,845
Purchase Details
Closed on
Oct 23, 2000
Sold by
Antoun Sami J and Antoun Deborah S
Bought by
Harton Gwendolyn D and Harton Decole M
Home Financials for this Owner
Home Financials are based on the most recent Mortgage that was taken out on this home.
Original Mortgage
$122,986
Interest Rate
7.96%
Mortgage Type
FHA
Purchase Details
Closed on
Nov 30, 1992
Bought by
Antoun Sami J and Antoun Deborah S
Create a Home Valuation Report for This Property
The Home Valuation Report is an in-depth analysis detailing your home's value as well as a comparison with similar homes in the area
Home Values in the Area
Average Home Value in this Area
Purchase History
| Date | Buyer | Sale Price | Title Company |
|---|---|---|---|
| Jackson Theresa | $138,500 | The Title Firm Inc | |
| Harton Gwendolyn D | $124,000 | -- | |
| Antoun Sami J | $95,100 | -- |
Source: Public Records
Mortgage History
| Date | Status | Borrower | Loan Amount |
|---|---|---|---|
| Open | Jackson Theresa | $138,500 | |
| Previous Owner | Harton Gwendolyn D | $122,986 |
Source: Public Records
Tax History Compared to Growth
Tax History
| Year | Tax Paid | Tax Assessment Tax Assessment Total Assessment is a certain percentage of the fair market value that is determined by local assessors to be the total taxable value of land and additions on the property. | Land | Improvement |
|---|---|---|---|---|
| 2024 | $3,635 | $81,000 | $17,820 | $63,180 |
| 2023 | $3,589 | $80,990 | $17,815 | $63,175 |
| 2022 | $2,494 | $48,090 | $6,300 | $41,790 |
| 2021 | $2,499 | $48,090 | $6,300 | $41,790 |
| 2020 | $2,502 | $48,090 | $6,300 | $41,790 |
| 2019 | $2,410 | $39,730 | $5,250 | $34,480 |
| 2018 | $2,160 | $39,730 | $5,250 | $34,480 |
| 2017 | $2,259 | $39,730 | $5,250 | $34,480 |
| 2016 | $2,110 | $31,850 | $6,790 | $25,060 |
| 2015 | $1,915 | $31,850 | $6,790 | $25,060 |
| 2014 | $1,920 | $31,850 | $6,790 | $25,060 |
| 2013 | $1,254 | $42,175 | $6,790 | $35,385 |
Source: Public Records
Map
Nearby Homes
- 5377 Bleaker Ave
- 5401 Spire Ln
- 5373 Spire Ln
- 3148 Aldgate St
- 3198 Gallant Dr
- 2998 Osgood Rd E
- 2991 Blue Moon Dr
- 5278 Glenbriar Ct
- 3289 Kady Ln
- 5882 Abernathy Ln Unit 5882F
- 2744 Barrows Rd
- 2730 Raphael Dr
- 2736 Barrows Rd
- 5936 Abernathy Ln
- 5938 Abernathy Ln
- 3298 Joshstock Dr
- 3304 Joshstock Dr
- 5944 Abernathy Ln
- 3310 Joshstock Dr
- St Martin Plan at Chatterton Commons
- 5345 Mendon Ct
- 5333 Mendon Ct
- 5340 Brayton Ave
- 5334 Brayton Ave
- 5353 Mendon Ct
- 5346 Brayton Ave
- 5336 Mendon Ct
- 5361 Mendon Ct
- 5354 Brayton Ave
- 5328 Brayton Ave
- 3046 Falcon Bridge Dr
- 3040 Falcon Bridge Dr
- 3052 Falcon Bridge Dr
- 3034 Falcon Bridge Dr
- 5350 Mendon Ct
- 5342 Mendon Ct
- 5358 Mendon Ct
- 5362 Brayton Ave
- 5367 Mendon Ct
- 3028 Falcon Bridge Dr