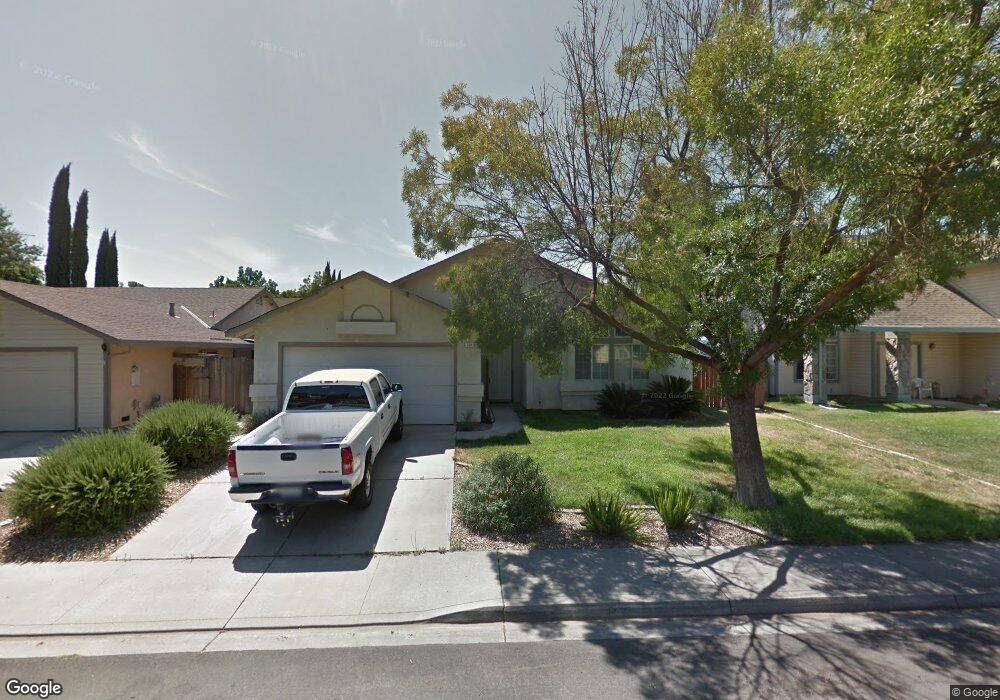
534 Messer Place Patterson, CA 95363
Estimated Value: $414,429 - $440,000
3
Beds
2
Baths
1,309
Sq Ft
$326/Sq Ft
Est. Value
About This Home
This home is located at 534 Messer Place, Patterson, CA 95363 and is currently estimated at $426,857, approximately $326 per square foot. 534 Messer Place is a home located in Stanislaus County with nearby schools including Las Palmas Elementary School, Creekside Middle School, and Patterson High School.
Ownership History
Date
Name
Owned For
Owner Type
Purchase Details
Closed on
Dec 17, 2002
Sold by
Brown Joshua L
Bought by
Vanzanten Albert
Current Estimated Value
Home Financials for this Owner
Home Financials are based on the most recent Mortgage that was taken out on this home.
Original Mortgage
$187,064
Outstanding Balance
$79,312
Interest Rate
6.06%
Mortgage Type
FHA
Estimated Equity
$347,545
Purchase Details
Closed on
Mar 5, 1999
Sold by
Barney Edgar L and Barney Melody A
Bought by
Brown Joshua L
Home Financials for this Owner
Home Financials are based on the most recent Mortgage that was taken out on this home.
Original Mortgage
$115,695
Interest Rate
6.79%
Mortgage Type
FHA
Purchase Details
Closed on
Jun 9, 1994
Sold by
Ortiz Gabriel C and Ortiz Ramona
Bought by
Barney Edgar L and Barney Melody A
Home Financials for this Owner
Home Financials are based on the most recent Mortgage that was taken out on this home.
Original Mortgage
$111,150
Interest Rate
8.83%
Create a Home Valuation Report for This Property
The Home Valuation Report is an in-depth analysis detailing your home's value as well as a comparison with similar homes in the area
Home Values in the Area
Average Home Value in this Area
Purchase History
| Date | Buyer | Sale Price | Title Company |
|---|---|---|---|
| Vanzanten Albert | $190,000 | Stewart Title Of Modesto | |
| Brown Joshua L | $116,500 | Chicago Title Co | |
| Barney Edgar L | $117,000 | Chicago Title Company |
Source: Public Records
Mortgage History
| Date | Status | Borrower | Loan Amount |
|---|---|---|---|
| Open | Vanzanten Albert | $187,064 | |
| Previous Owner | Brown Joshua L | $115,695 | |
| Previous Owner | Barney Edgar L | $111,150 |
Source: Public Records
Tax History Compared to Growth
Tax History
| Year | Tax Paid | Tax Assessment Tax Assessment Total Assessment is a certain percentage of the fair market value that is determined by local assessors to be the total taxable value of land and additions on the property. | Land | Improvement |
|---|---|---|---|---|
| 2025 | $3,270 | $275,163 | $108,614 | $166,549 |
| 2024 | $3,261 | $269,769 | $106,485 | $163,284 |
| 2023 | $3,189 | $264,481 | $104,398 | $160,083 |
| 2022 | $3,010 | $259,296 | $102,351 | $156,945 |
| 2021 | $2,986 | $254,213 | $100,345 | $153,868 |
| 2020 | $2,970 | $251,608 | $99,317 | $152,291 |
| 2019 | $2,926 | $246,675 | $97,370 | $149,305 |
| 2018 | $2,787 | $241,839 | $95,461 | $146,378 |
| 2017 | $2,730 | $237,098 | $93,590 | $143,508 |
| 2016 | $2,581 | $232,450 | $91,755 | $140,695 |
| 2015 | $2,082 | $187,500 | $33,500 | $154,000 |
| 2014 | $1,562 | $140,000 | $25,000 | $115,000 |
Source: Public Records
Map
Nearby Homes
- 250 E Las Palmas Ave Unit 13
- 250 E Las Palmas Ave Unit 8
- 505 Berlin Way
- 229 Tyler St
- 344 Knutson St
- 10037 California 33
- 304 S 3rd St
- 113 S 3rd St
- 123 Washburn St
- 774 Bogdanich Pkwy
- 0 Orange Ave
- 331 D St
- 375 I St
- 23 S 5th St
- 518 Bedfordshire Dr
- 470 J St
- 775 Sweetwood Ln
- 564 Millwood Dr
- 722 Haworth Dr
- 300 S 7th St
- 538 Messer Place
- 530 Messer Place
- 533 Westfield Place
- 537 Westfield Place
- 529 Westfield Place
- 542 Messer Place
- 526 Messer Place
- 535 Messer Place
- 541 Westfield Place
- 525 Westfield Place
- 539 Messer Place
- 531 Messer Place
- 546 Messer Place
- 543 Messer Place
- 527 Messer Place
- 545 Westfield Place
- 522 Messer Place
- 521 Westfield Place
- 547 Messer Place
- 550 Messer Place