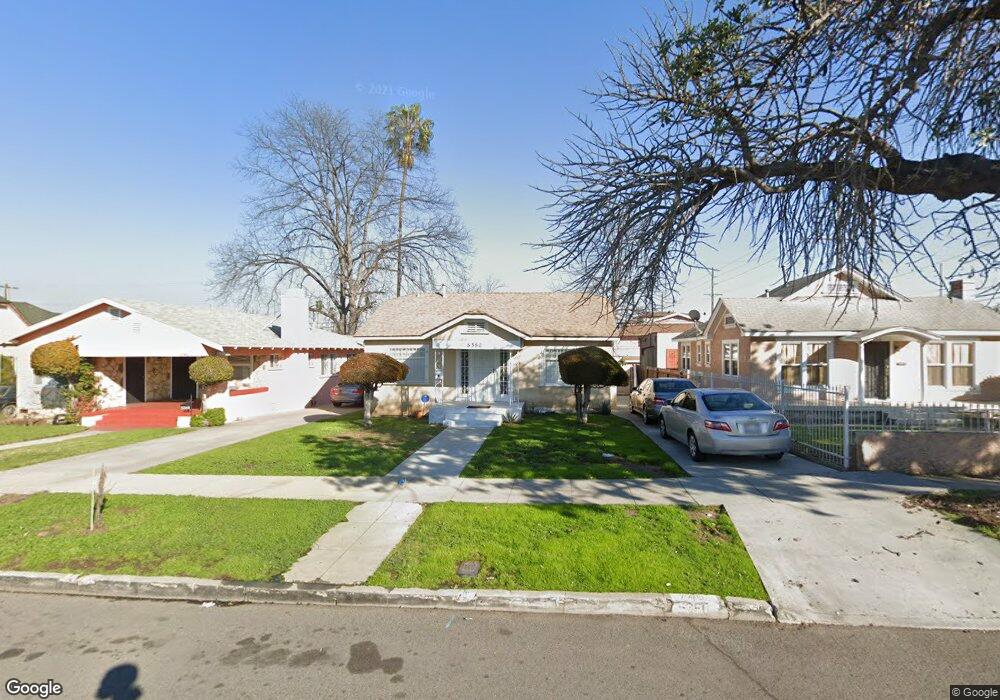
5350 8th Ave Los Angeles, CA 90043
Hyde Park NeighborhoodEstimated Value: $618,000 - $1,301,000
3
Beds
1
Bath
1,006
Sq Ft
$814/Sq Ft
Est. Value
About This Home
This home is located at 5350 8th Ave, Los Angeles, CA 90043 and is currently estimated at $819,076, approximately $814 per square foot. 5350 8th Ave is a home located in Los Angeles County with nearby schools including Angeles Mesa Elementary School, Audubon Middle School, and Crenshaw Science, Technology, Engineering, Math And Medicine Magnet.
Ownership History
Date
Name
Owned For
Owner Type
Purchase Details
Closed on
Oct 2, 2008
Sold by
Smith Damien Mcneal
Bought by
Smith Zoia A
Current Estimated Value
Home Financials for this Owner
Home Financials are based on the most recent Mortgage that was taken out on this home.
Original Mortgage
$140,250
Interest Rate
6.04%
Mortgage Type
Purchase Money Mortgage
Purchase Details
Closed on
Sep 10, 2008
Sold by
Mcdonald Tamia
Bought by
Smith Zoia A
Home Financials for this Owner
Home Financials are based on the most recent Mortgage that was taken out on this home.
Original Mortgage
$140,250
Interest Rate
6.04%
Mortgage Type
Purchase Money Mortgage
Purchase Details
Closed on
Jul 6, 2000
Sold by
Canson Joyce E Decd Est Of
Bought by
Joffrion Bertha L
Home Financials for this Owner
Home Financials are based on the most recent Mortgage that was taken out on this home.
Original Mortgage
$114,059
Interest Rate
8.07%
Mortgage Type
FHA
Create a Home Valuation Report for This Property
The Home Valuation Report is an in-depth analysis detailing your home's value as well as a comparison with similar homes in the area
Home Values in the Area
Average Home Value in this Area
Purchase History
| Date | Buyer | Sale Price | Title Company |
|---|---|---|---|
| Smith Zoia A | -- | Southland Title Company | |
| Smith Zoia A | $187,000 | Southland Title Company | |
| Joffrion Bertha L | $115,000 | Gateway Title Company |
Source: Public Records
Mortgage History
| Date | Status | Borrower | Loan Amount |
|---|---|---|---|
| Previous Owner | Smith Zoia A | $140,250 | |
| Previous Owner | Joffrion Bertha L | $114,059 |
Source: Public Records
Tax History Compared to Growth
Tax History
| Year | Tax Paid | Tax Assessment Tax Assessment Total Assessment is a certain percentage of the fair market value that is determined by local assessors to be the total taxable value of land and additions on the property. | Land | Improvement |
|---|---|---|---|---|
| 2025 | $3,123 | $240,792 | $192,640 | $48,152 |
| 2024 | $3,070 | $236,071 | $188,863 | $47,208 |
| 2023 | $3,018 | $231,443 | $185,160 | $46,283 |
| 2022 | $2,886 | $226,906 | $181,530 | $45,376 |
| 2021 | $2,845 | $222,458 | $177,971 | $44,487 |
| 2019 | $2,764 | $215,862 | $172,694 | $43,168 |
| 2018 | $2,719 | $211,630 | $169,308 | $42,322 |
| 2016 | $2,598 | $203,415 | $162,735 | $40,680 |
| 2015 | $2,561 | $200,360 | $160,291 | $40,069 |
| 2014 | $2,580 | $196,437 | $157,152 | $39,285 |
Source: Public Records
Map
Nearby Homes