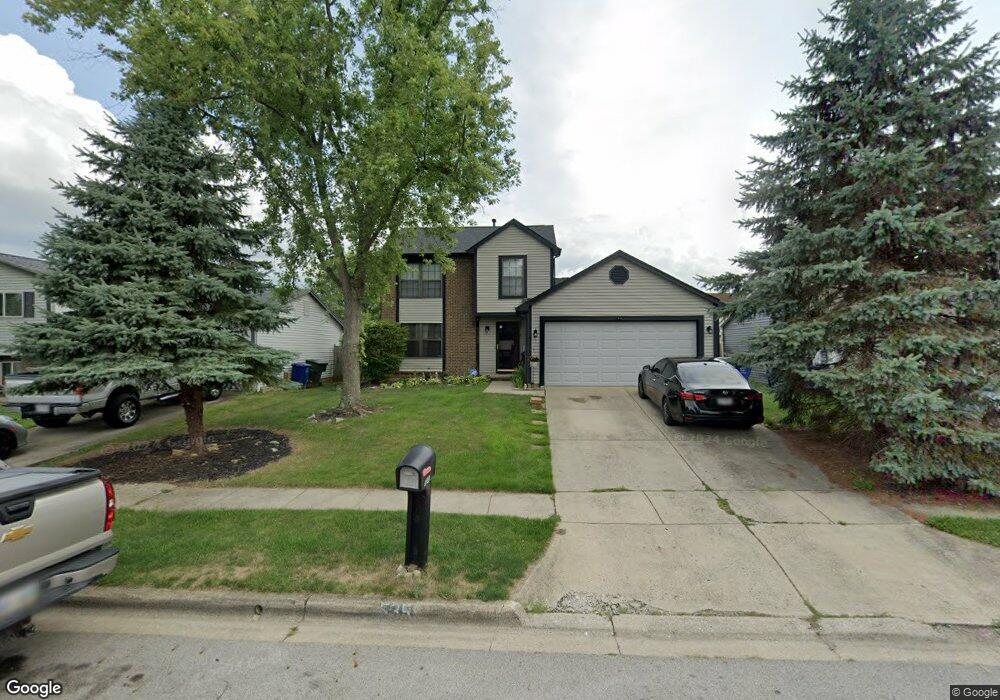
5359 Chaumonte Ave Columbus, OH 43232
Walnut Heights NeighborhoodEstimated Value: $241,000 - $287,000
3
Beds
2
Baths
1,950
Sq Ft
$138/Sq Ft
Est. Value
About This Home
This home is located at 5359 Chaumonte Ave, Columbus, OH 43232 and is currently estimated at $269,441, approximately $138 per square foot. 5359 Chaumonte Ave is a home located in Franklin County with nearby schools including Liberty Elementary School, Yorktown Middle School, and Independence High School.
Ownership History
Date
Name
Owned For
Owner Type
Purchase Details
Closed on
Sep 24, 2009
Sold by
Williams Thomas E and Williams Elizabeth B
Bought by
Groce Janice
Current Estimated Value
Home Financials for this Owner
Home Financials are based on the most recent Mortgage that was taken out on this home.
Original Mortgage
$99,661
Outstanding Balance
$65,442
Interest Rate
5.19%
Mortgage Type
FHA
Estimated Equity
$203,999
Purchase Details
Closed on
Nov 4, 2002
Sold by
Johnson Ronnie L and Johnson Jewel E
Bought by
Williams Thomas E and Williams Elizabeth B
Home Financials for this Owner
Home Financials are based on the most recent Mortgage that was taken out on this home.
Original Mortgage
$116,850
Interest Rate
6.08%
Mortgage Type
Purchase Money Mortgage
Purchase Details
Closed on
Jul 10, 1998
Sold by
Vanorder Don P
Bought by
Johnson Ronnie L and Johnson Jewel E
Home Financials for this Owner
Home Financials are based on the most recent Mortgage that was taken out on this home.
Original Mortgage
$103,528
Interest Rate
7.15%
Mortgage Type
FHA
Purchase Details
Closed on
Jun 5, 1991
Create a Home Valuation Report for This Property
The Home Valuation Report is an in-depth analysis detailing your home's value as well as a comparison with similar homes in the area
Home Values in the Area
Average Home Value in this Area
Purchase History
| Date | Buyer | Sale Price | Title Company |
|---|---|---|---|
| Groce Janice | $101,500 | Stewart Tit | |
| Williams Thomas E | $123,000 | Professional Closing Title A | |
| Johnson Ronnie L | $105,500 | -- | |
| -- | $82,000 | -- |
Source: Public Records
Mortgage History
| Date | Status | Borrower | Loan Amount |
|---|---|---|---|
| Open | Groce Janice | $99,661 | |
| Previous Owner | Williams Thomas E | $116,850 | |
| Previous Owner | Johnson Ronnie L | $103,528 |
Source: Public Records
Tax History Compared to Growth
Tax History
| Year | Tax Paid | Tax Assessment Tax Assessment Total Assessment is a certain percentage of the fair market value that is determined by local assessors to be the total taxable value of land and additions on the property. | Land | Improvement |
|---|---|---|---|---|
| 2024 | $3,266 | $72,770 | $16,980 | $55,790 |
| 2023 | $3,224 | $72,765 | $16,975 | $55,790 |
| 2022 | $1,970 | $37,980 | $5,250 | $32,730 |
| 2021 | $1,973 | $37,980 | $5,250 | $32,730 |
| 2020 | $1,976 | $37,980 | $5,250 | $32,730 |
| 2019 | $1,865 | $30,740 | $4,380 | $26,360 |
| 2018 | $1,831 | $30,740 | $4,380 | $26,360 |
| 2017 | $1,864 | $30,740 | $4,380 | $26,360 |
| 2016 | $1,985 | $29,960 | $5,040 | $24,920 |
| 2015 | $1,802 | $29,960 | $5,040 | $24,920 |
| 2014 | $1,806 | $29,960 | $5,040 | $24,920 |
| 2013 | $990 | $33,285 | $5,600 | $27,685 |
Source: Public Records
Map
Nearby Homes
- 3151 Crossgate Rd
- 5365 Sherry Ct
- 5401 Spire Ln
- 5373 Spire Ln
- 3198 Gallant Dr
- 5393 Centner Ln
- 3118 Legion Ln
- 3000 Whitlow Rd
- 2998 Osgood Rd E
- 2744 Barrows Rd
- 2736 Barrows Rd
- 5882 Abernathy Ln Unit 5882F
- 2730 Raphael Dr
- 5936 Abernathy Ln
- 3057 Lamptonridge Dr
- 5938 Abernathy Ln
- 5944 Abernathy Ln
- 5946 Abernathy Ln
- 3298 Joshstock Dr
- 3304 Joshstock Dr
- 5353 Chaumonte Ave
- 5352 Chaumonte Ave
- 5365 Chaumonte Ave
- 5347 Chaumonte Ave
- 5371 Chaumonte Ave
- 2329 Chaumonte Ave
- 5358 Mendon Ct
- 5350 Mendon Ct
- 5364 Mendon Ct
- 5370 Mendon Ct
- 5341 Chaumonte Ave
- 5383 Chaumonte Ave
- 5362 Chaumonte Ave
- 5356 Chaumonte Ave
- 5368 Chaumonte Ave
- 5342 Mendon Ct
- 5376 Mendon Ct
- 5335 Chaumonte Ave
- 5330 Chaumonte Ave
- 5380 Chaumonte Ave