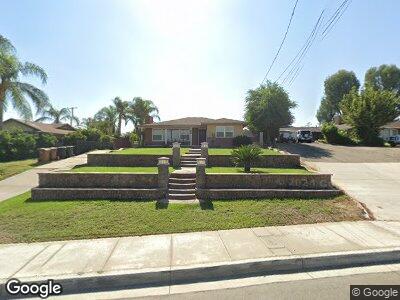
536 W C St Colton, CA 92324
Estimated Value: $475,000 - $595,000
2
Beds
2
Baths
1,502
Sq Ft
$351/Sq Ft
Est. Value
About This Home
This home is located at 536 W C St, Colton, CA 92324 and is currently estimated at $527,610, approximately $351 per square foot. 536 W C St is a home located in San Bernardino County with nearby schools including Ulysses Grant Elementary School, Colton Middle School, and Colton High School.
Ownership History
Date
Name
Owned For
Owner Type
Purchase Details
Closed on
Jan 27, 2002
Sold by
Coleman Necia I
Bought by
Morana Brian and Morana Rose Mary
Current Estimated Value
Home Financials for this Owner
Home Financials are based on the most recent Mortgage that was taken out on this home.
Original Mortgage
$147,910
Interest Rate
6.78%
Mortgage Type
FHA
Purchase Details
Closed on
Sep 17, 1996
Sold by
Coleman William J
Bought by
Coleman Necia L
Create a Home Valuation Report for This Property
The Home Valuation Report is an in-depth analysis detailing your home's value as well as a comparison with similar homes in the area
Home Values in the Area
Average Home Value in this Area
Purchase History
| Date | Buyer | Sale Price | Title Company |
|---|---|---|---|
| Morana Brian | $150,000 | First American |
Source: Public Records
Mortgage History
| Date | Status | Borrower | Loan Amount |
|---|---|---|---|
| Open | Morana Brian | $285,000 | |
| Closed | Morana Rose M | $50,000 | |
| Closed | Morana Brian | $231,000 | |
| Closed | Morana Brian | $182,700 | |
| Previous Owner | Morana Brian | $147,910 |
Source: Public Records
Tax History Compared to Growth
Tax History
| Year | Tax Paid | Tax Assessment Tax Assessment Total Assessment is a certain percentage of the fair market value that is determined by local assessors to be the total taxable value of land and additions on the property. | Land | Improvement |
|---|---|---|---|---|
| 2024 | $2,566 | $217,253 | $54,314 | $162,939 |
| 2023 | $2,572 | $212,993 | $53,249 | $159,744 |
| 2022 | $2,534 | $208,817 | $52,205 | $156,612 |
| 2021 | $2,584 | $204,722 | $51,181 | $153,541 |
| 2020 | $2,594 | $202,623 | $50,656 | $151,967 |
| 2019 | $2,540 | $198,650 | $49,663 | $148,987 |
| 2018 | $2,571 | $194,755 | $48,689 | $146,066 |
| 2017 | $2,482 | $190,936 | $47,734 | $143,202 |
| 2016 | $2,544 | $187,192 | $46,798 | $140,394 |
| 2015 | $2,463 | $184,380 | $46,095 | $138,285 |
| 2014 | $2,135 | $162,000 | $49,000 | $113,000 |
Source: Public Records
Map
Nearby Homes