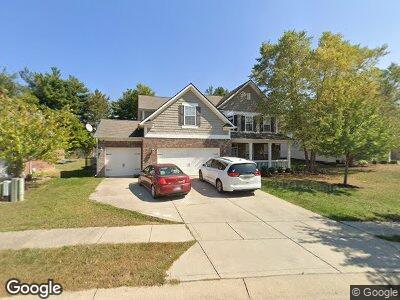
5365 Ralfe Rd Indianapolis, IN 46234
Estimated Value: $368,000 - $405,000
3
Beds
3
Baths
3,092
Sq Ft
$127/Sq Ft
Est. Value
About This Home
This home is located at 5365 Ralfe Rd, Indianapolis, IN 46234 and is currently estimated at $391,974, approximately $126 per square foot. 5365 Ralfe Rd is a home located in Hendricks County with nearby schools including Reagan Elementary School, Brownsburg East Middle School, and Brownsburg High School.
Ownership History
Date
Name
Owned For
Owner Type
Purchase Details
Closed on
Jun 28, 2021
Sold by
Dunning Meloney A and Mitchell Adam J
Bought by
Lawrence Nathan and Anderson Ashley M
Current Estimated Value
Home Financials for this Owner
Home Financials are based on the most recent Mortgage that was taken out on this home.
Original Mortgage
$268,000
Outstanding Balance
$245,267
Interest Rate
2.9%
Mortgage Type
New Conventional
Estimated Equity
$146,707
Purchase Details
Closed on
Dec 21, 2007
Sold by
Trinity Homes Llc
Bought by
Dunning Meloney A and Mitchell Adam J
Home Financials for this Owner
Home Financials are based on the most recent Mortgage that was taken out on this home.
Original Mortgage
$36,050
Interest Rate
6.27%
Mortgage Type
Stand Alone Second
Create a Home Valuation Report for This Property
The Home Valuation Report is an in-depth analysis detailing your home's value as well as a comparison with similar homes in the area
Home Values in the Area
Average Home Value in this Area
Purchase History
| Date | Buyer | Sale Price | Title Company |
|---|---|---|---|
| Lawrence Nathan | -- | None Available | |
| Dunning Meloney A | -- | Title Manager | |
| Trinity Homes Llc | -- | None Available |
Source: Public Records
Mortgage History
| Date | Status | Borrower | Loan Amount |
|---|---|---|---|
| Open | Lawrence Nathan | $268,000 | |
| Previous Owner | Dunning Meloney A | $217,373 | |
| Previous Owner | Dunning Meloney A | $186,200 | |
| Previous Owner | Dunning Meloney A | $36,050 | |
| Previous Owner | Trinity Homes Llc | $192,280 |
Source: Public Records
Tax History Compared to Growth
Tax History
| Year | Tax Paid | Tax Assessment Tax Assessment Total Assessment is a certain percentage of the fair market value that is determined by local assessors to be the total taxable value of land and additions on the property. | Land | Improvement |
|---|---|---|---|---|
| 2024 | $3,701 | $370,100 | $51,600 | $318,500 |
| 2023 | $3,338 | $333,800 | $46,100 | $287,700 |
| 2022 | $3,189 | $318,900 | $43,500 | $275,400 |
| 2021 | $2,700 | $270,000 | $39,500 | $230,500 |
| 2020 | $2,477 | $247,700 | $39,500 | $208,200 |
| 2019 | $2,443 | $244,300 | $37,600 | $206,700 |
| 2018 | $2,311 | $231,100 | $37,600 | $193,500 |
| 2017 | $2,332 | $233,200 | $35,800 | $197,400 |
| 2016 | $2,251 | $225,100 | $35,800 | $189,300 |
| 2014 | $2,173 | $217,300 | $33,700 | $183,600 |
Source: Public Records
Map
Nearby Homes
- 5524 Goodwin St
- 5650 Goodwin St
- 5772 Jamestown Square Ln
- 5817 Jamestown Square Ln
- 5782 Jamestown Square Ln
- 5809 Scotland St
- 5869 Jamestown Square Ln
- 9250 Woodacre Boulevard Dr S
- 10689 Brooks St
- 5190 Potters Pike
- 6055 Bluecrest Dr
- 4707 Branch View Way
- 5351 Potters Pike
- 10349 Gateway Dr
- 6034 Bluecrest Dr
- 5565 Noble Dr
- 10329 Gateway Dr
- 10090 Eagle Eye Way
- 6059 Bluecrest Dr
- 10307 Gateway Dr