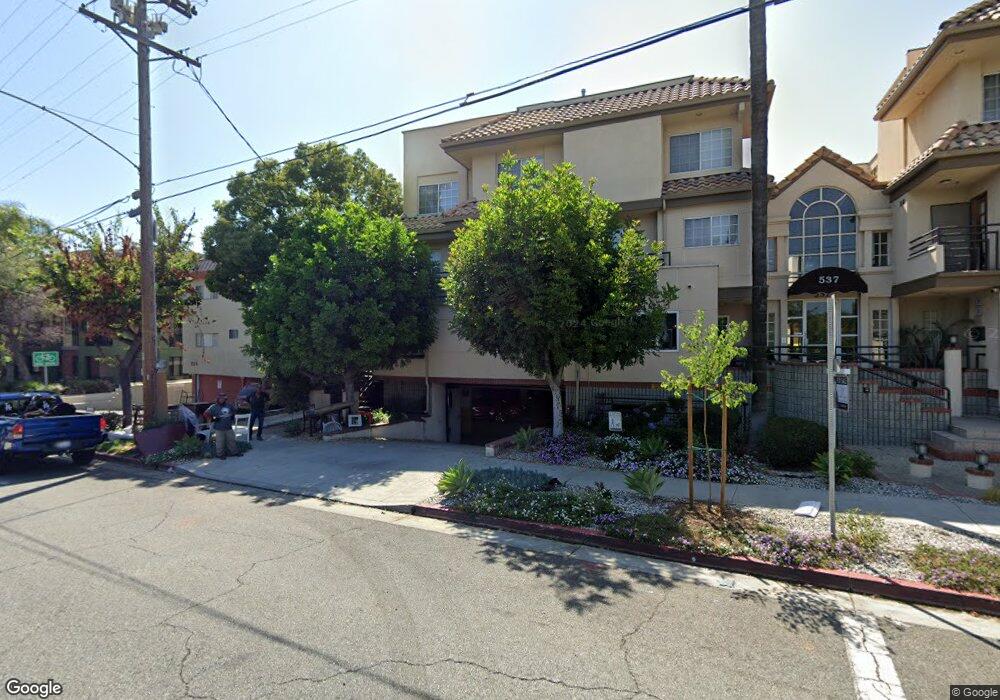
537 N Adams St Unit 106 Glendale, CA 91206
Citrus Grove NeighborhoodEstimated Value: $767,000 - $998,000
3
Beds
3
Baths
1,459
Sq Ft
$577/Sq Ft
Est. Value
About This Home
This home is located at 537 N Adams St Unit 106, Glendale, CA 91206 and is currently estimated at $841,492, approximately $576 per square foot. 537 N Adams St Unit 106 is a home located in Los Angeles County with nearby schools including R.D. White Elementary School, Woodrow Wilson Middle School, and Glendale High School.
Ownership History
Date
Name
Owned For
Owner Type
Purchase Details
Closed on
Nov 12, 2024
Sold by
Razmik And Clarisse Aslanian Family Trus and Armond And Alin Aslanian Family Trust
Bought by
Aslan Holdings Llc
Current Estimated Value
Purchase Details
Closed on
Nov 2, 2022
Sold by
Aslanian Ratmik and Aslanian Clarisse
Bought by
Razmik Aslanian And Clarisse Aslanian Family
Purchase Details
Closed on
Sep 19, 2022
Sold by
Aslanian and Alin
Bought by
Armond And Alin Aslanian Family Trust
Purchase Details
Closed on
Apr 17, 2008
Sold by
Saxon Mortgage Services Inc
Bought by
Aslanian Razmik
Home Financials for this Owner
Home Financials are based on the most recent Mortgage that was taken out on this home.
Original Mortgage
$315,000
Interest Rate
5.8%
Mortgage Type
Purchase Money Mortgage
Purchase Details
Closed on
Sep 20, 2007
Sold by
Cho Min Ji
Bought by
Morgan Stanley Mortgage Capital Inc and Saxon Mortgage Services Inc
Purchase Details
Closed on
Oct 5, 2006
Sold by
Jeong In R
Bought by
Cho Min Ji
Home Financials for this Owner
Home Financials are based on the most recent Mortgage that was taken out on this home.
Original Mortgage
$420,000
Interest Rate
7.97%
Mortgage Type
Balloon
Purchase Details
Closed on
Jun 10, 2004
Sold by
Song Seok
Bought by
Jeong In R
Purchase Details
Closed on
Nov 24, 2003
Sold by
Jeong In Rye
Bought by
Song Seok
Purchase Details
Closed on
Mar 14, 2001
Sold by
Koo Jeong W and Koo Seung H
Bought by
Jeong In Ryea
Home Financials for this Owner
Home Financials are based on the most recent Mortgage that was taken out on this home.
Original Mortgage
$208,000
Interest Rate
7.03%
Mortgage Type
Stand Alone First
Purchase Details
Closed on
Jan 26, 1998
Sold by
Federal National Mortgage Association
Bought by
Koo Jeong W and Koo Seung H
Home Financials for this Owner
Home Financials are based on the most recent Mortgage that was taken out on this home.
Original Mortgage
$140,600
Interest Rate
6.9%
Purchase Details
Closed on
Oct 17, 1997
Sold by
Tirone Mary Ann and Federal National Mortgage Asso
Bought by
Federal National Mortgage Association
Purchase Details
Closed on
Jul 24, 1995
Sold by
Capital City Financial Inc
Bought by
Tirone Mary Ann
Home Financials for this Owner
Home Financials are based on the most recent Mortgage that was taken out on this home.
Original Mortgage
$120,000
Interest Rate
7.62%
Create a Home Valuation Report for This Property
The Home Valuation Report is an in-depth analysis detailing your home's value as well as a comparison with similar homes in the area
Home Values in the Area
Average Home Value in this Area
Purchase History
| Date | Buyer | Sale Price | Title Company |
|---|---|---|---|
| Aslan Holdings Llc | -- | None Listed On Document | |
| Aslan Holdings Llc | -- | None Listed On Document | |
| Razmik Aslanian And Clarisse Aslanian Family | -- | -- | |
| Armond And Alin Aslanian Family Trust | -- | -- | |
| Aslanian Razmik | $394,000 | Lsi Title | |
| Saxon Mortgage Services Inc | $394,000 | Lsi Title | |
| Morgan Stanley Mortgage Capital Inc | $446,250 | None Available | |
| Cho Min Ji | $525,000 | Fidelity Natl Title Co Oc | |
| Jeong In R | -- | -- | |
| Song Seok | -- | -- | |
| Jeong In Ryea | $208,000 | Chicago Title | |
| Koo Jeong W | $148,000 | Commonwealth Land Title Co | |
| Federal National Mortgage Association | $115,000 | -- | |
| Tirone Mary Ann | $156,000 | Continental Lawyers Title Co |
Source: Public Records
Mortgage History
| Date | Status | Borrower | Loan Amount |
|---|---|---|---|
| Previous Owner | Aslanian Razmik | $315,000 | |
| Previous Owner | Cho Min Ji | $420,000 | |
| Previous Owner | Jeong In Ryea | $208,000 | |
| Previous Owner | Koo Jeong W | $140,600 | |
| Previous Owner | Tirone Mary Ann | $120,000 |
Source: Public Records
Tax History Compared to Growth
Tax History
| Year | Tax Paid | Tax Assessment Tax Assessment Total Assessment is a certain percentage of the fair market value that is determined by local assessors to be the total taxable value of land and additions on the property. | Land | Improvement |
|---|---|---|---|---|
| 2025 | $5,663 | $517,509 | $262,693 | $254,816 |
| 2024 | $5,663 | $507,363 | $257,543 | $249,820 |
| 2023 | $5,534 | $497,416 | $252,494 | $244,922 |
| 2022 | $5,436 | $487,664 | $247,544 | $240,120 |
| 2021 | $5,339 | $478,103 | $242,691 | $235,412 |
| 2019 | $5,133 | $463,925 | $235,494 | $228,431 |
| 2018 | $5,063 | $454,829 | $230,877 | $223,952 |
| 2017 | $4,983 | $445,911 | $226,350 | $219,561 |
| 2016 | $4,824 | $437,168 | $221,912 | $215,256 |
| 2015 | $4,726 | $430,602 | $218,579 | $212,023 |
| 2014 | $4,687 | $422,168 | $214,298 | $207,870 |
Source: Public Records
Map
Nearby Homes
- 444 Piedmont Ave Unit 323
- 444 Piedmont Ave Unit 206
- 529 Naranja Dr
- 732 Cordova Ave
- 920 Coronado Dr
- 535 Woodbury Rd
- 232 N Belmont St
- 500 Woodbury Rd
- 330 N Howard St Unit 212
- 330 N Howard St Unit 311
- 330 N Howard St Unit 201
- 1015 E Wilson Ave
- 1322 E California Ave
- 243 N Verdugo Rd
- 420 Canyon Dr
- 641 Canyon Dr
- 241 N Verdugo Rd
- 500 Jackson Place Unit 224
- 341 N Isabel St
- 300 N Isabel St Unit 10
- 537 N Adams St
- 537 N Adams St Unit 209
- 537 N Adams St Unit 208
- 537 N Adams St Unit 207
- 537 N Adams St Unit 206
- 537 N Adams St Unit 205
- 537 N Adams St Unit 204
- 537 N Adams St Unit 203
- 537 N Adams St Unit 202
- 537 N Adams St Unit 201
- 537 N Adams St Unit 110
- 537 N Adams St Unit 109
- 537 N Adams St Unit 108
- 537 N Adams St Unit 107
- 537 N Adams St Unit 104
- 537 N Adams St Unit 103
- 537 N Adams St Unit 102
- 537 N Adams St Unit 101
- 537 N Adams St Unit 221
- 537 N Adams St Unit 220