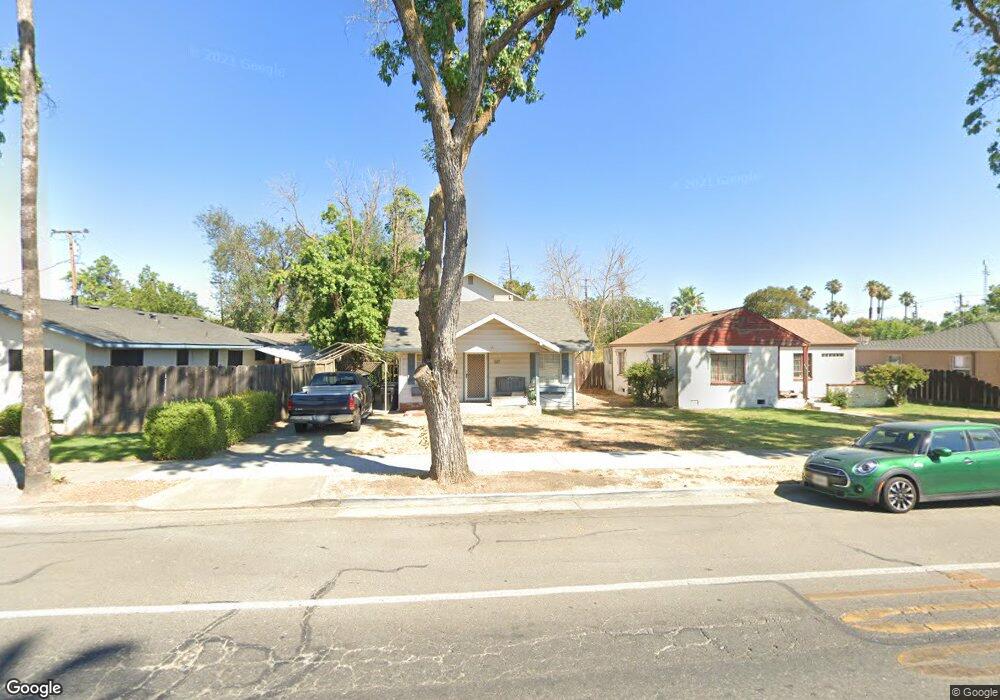
537 W Las Palmas Ave Patterson, CA 95363
Estimated Value: $401,837 - $511,000
2
Beds
2
Baths
1,704
Sq Ft
$264/Sq Ft
Est. Value
About This Home
This home is located at 537 W Las Palmas Ave, Patterson, CA 95363 and is currently estimated at $449,459, approximately $263 per square foot. 537 W Las Palmas Ave is a home located in Stanislaus County with nearby schools including Las Palmas Elementary School, Creekside Middle School, and Patterson High School.
Ownership History
Date
Name
Owned For
Owner Type
Purchase Details
Closed on
May 10, 2001
Sold by
Jacobs Judith A
Bought by
Dickinson Tamur Eric and Dickson Debra L
Current Estimated Value
Home Financials for this Owner
Home Financials are based on the most recent Mortgage that was taken out on this home.
Original Mortgage
$140,000
Interest Rate
7.15%
Purchase Details
Closed on
Apr 16, 1996
Sold by
Jacobs Judith A and The Joseph & Judith Jacobs Fam
Bought by
Jacobs Judith A
Home Financials for this Owner
Home Financials are based on the most recent Mortgage that was taken out on this home.
Original Mortgage
$92,250
Interest Rate
7.84%
Purchase Details
Closed on
Feb 7, 1994
Sold by
Jacobs Joseph and Jacobs Judith A
Bought by
Jacobs Joseph and Jacobs Judith A
Create a Home Valuation Report for This Property
The Home Valuation Report is an in-depth analysis detailing your home's value as well as a comparison with similar homes in the area
Home Values in the Area
Average Home Value in this Area
Purchase History
| Date | Buyer | Sale Price | Title Company |
|---|---|---|---|
| Dickinson Tamur Eric | $175,000 | Fidelity National Title Co | |
| Jacobs Judith A | -- | North American Title Co | |
| Jacobs Joseph | -- | -- |
Source: Public Records
Mortgage History
| Date | Status | Borrower | Loan Amount |
|---|---|---|---|
| Previous Owner | Dickinson Tamur Eric | $140,000 | |
| Previous Owner | Jacobs Judith A | $92,250 |
Source: Public Records
Tax History Compared to Growth
Tax History
| Year | Tax Paid | Tax Assessment Tax Assessment Total Assessment is a certain percentage of the fair market value that is determined by local assessors to be the total taxable value of land and additions on the property. | Land | Improvement |
|---|---|---|---|---|
| 2025 | $1,259 | $106,800 | $18,981 | $87,819 |
| 2024 | $1,255 | $104,707 | $18,609 | $86,098 |
| 2023 | $1,227 | $102,655 | $18,245 | $84,410 |
| 2022 | $1,158 | $100,643 | $17,888 | $82,755 |
| 2021 | $1,149 | $98,671 | $17,538 | $81,133 |
| 2020 | $1,142 | $97,661 | $17,359 | $80,302 |
| 2019 | $1,125 | $95,747 | $17,019 | $78,728 |
| 2018 | $1,071 | $93,871 | $16,686 | $77,185 |
| 2017 | $1,044 | $92,031 | $16,359 | $75,672 |
| 2016 | $1,021 | $90,228 | $16,039 | $74,189 |
| 2015 | $1,006 | $88,874 | $15,799 | $73,075 |
| 2014 | $983 | $87,134 | $15,490 | $71,644 |
Source: Public Records
Map
Nearby Homes
- 23 S 5th St
- 113 S 3rd St
- 375 I St
- 470 J St
- 10037 California 33
- 300 S 7th St
- 331 D St
- 15707 S 9th St
- 304 S 3rd St
- 708 Bonneau Ct
- 527 Sunflower Dr
- 250 E Las Palmas Ave Unit 13
- 250 E Las Palmas Ave Unit 8
- 849 Miraggio Dr
- 0 Orange Ave
- 559 S Del Puerto Ave
- 229 Tyler St
- 123 Washburn St
- 1137 Blue Heron Dr
- 344 Knutson St