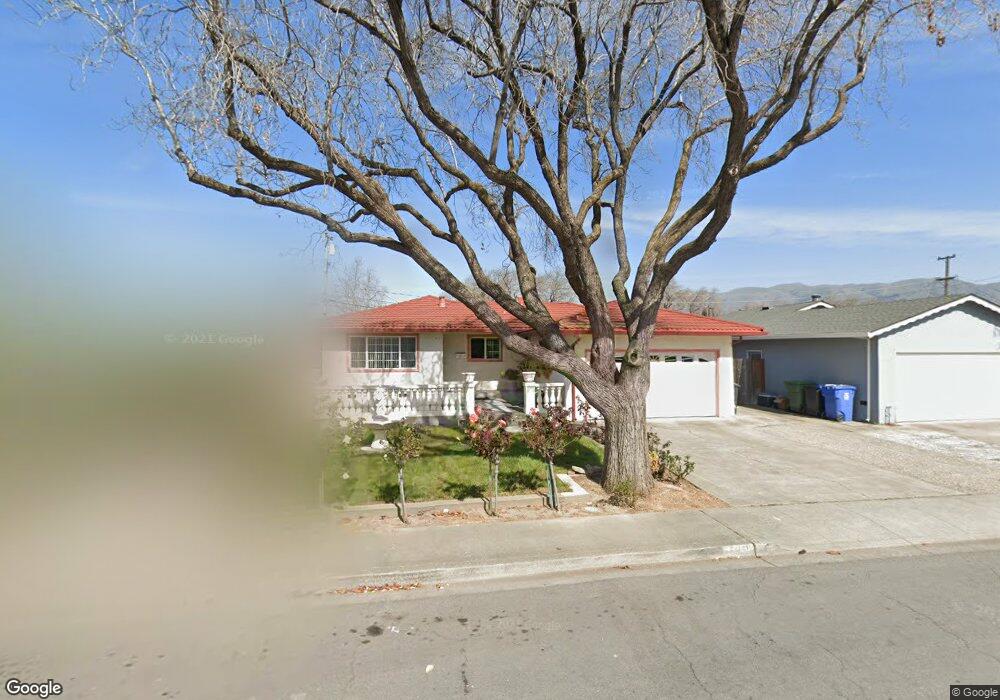
539 Maple Ave Milpitas, CA 95035
Estimated Value: $1,486,000 - $1,612,775
5
Beds
3
Baths
1,253
Sq Ft
$1,241/Sq Ft
Est. Value
About This Home
This home is located at 539 Maple Ave, Milpitas, CA 95035 and is currently estimated at $1,554,694, approximately $1,240 per square foot. 539 Maple Ave is a home located in Santa Clara County with nearby schools including Anthony Spangler Elementary School, Thomas Russell Middle School, and Milpitas High School.
Ownership History
Date
Name
Owned For
Owner Type
Purchase Details
Closed on
Nov 30, 2023
Sold by
Gilana Cesar P and Gilana Almira P
Bought by
Cesar And Almira Gilana Revocable Living Trus and Gilana
Current Estimated Value
Purchase Details
Closed on
Jul 24, 2001
Sold by
Gilana Cesar P and Gascon Almira P
Bought by
Gilana Cesar P and Gascon Almira P
Home Financials for this Owner
Home Financials are based on the most recent Mortgage that was taken out on this home.
Original Mortgage
$287,000
Interest Rate
6.87%
Purchase Details
Closed on
Apr 25, 2000
Sold by
Gilana Cesar
Bought by
Gascon Benito and Gascon Perlita
Purchase Details
Closed on
Dec 20, 1999
Sold by
Allen Mangune
Bought by
Gilana Ceasar and Gascon Almira P
Home Financials for this Owner
Home Financials are based on the most recent Mortgage that was taken out on this home.
Original Mortgage
$285,000
Interest Rate
7.75%
Purchase Details
Closed on
Sep 29, 1997
Sold by
Gascon Benito R
Bought by
Gascon Perlita P
Home Financials for this Owner
Home Financials are based on the most recent Mortgage that was taken out on this home.
Original Mortgage
$226,575
Interest Rate
5.37%
Create a Home Valuation Report for This Property
The Home Valuation Report is an in-depth analysis detailing your home's value as well as a comparison with similar homes in the area
Home Values in the Area
Average Home Value in this Area
Purchase History
| Date | Buyer | Sale Price | Title Company |
|---|---|---|---|
| Cesar And Almira Gilana Revocable Living Trus | -- | None Listed On Document | |
| Gilana Cesar P | -- | North American Title Co | |
| Gascon Benito | $18,500 | -- | |
| Gilana Ceasar | $285,000 | Financial Title Company | |
| Gascon Perlita P | -- | Golden California Title Co | |
| Mangune Allen | $239,000 | Golden California Title Co |
Source: Public Records
Mortgage History
| Date | Status | Borrower | Loan Amount |
|---|---|---|---|
| Previous Owner | Gilana Cesar P | $287,000 | |
| Previous Owner | Gilana Ceasar | $285,000 | |
| Previous Owner | Mangune Allen | $226,575 |
Source: Public Records
Tax History
| Year | Tax Paid | Tax Assessment Tax Assessment Total Assessment is a certain percentage of the fair market value that is determined by local assessors to be the total taxable value of land and additions on the property. | Land | Improvement |
|---|---|---|---|---|
| 2025 | $7,011 | $608,789 | $240,610 | $368,179 |
| 2024 | $7,011 | $596,853 | $235,893 | $360,960 |
| 2023 | $7,069 | $585,151 | $231,268 | $353,883 |
| 2022 | $7,042 | $573,679 | $226,734 | $346,945 |
| 2021 | $6,940 | $562,432 | $222,289 | $340,143 |
| 2020 | $6,820 | $556,666 | $220,010 | $336,656 |
| 2019 | $6,744 | $545,752 | $215,697 | $330,055 |
| 2018 | $5,530 | $458,643 | $211,468 | $247,175 |
| 2017 | $5,049 | $414,063 | $207,322 | $206,741 |
| 2016 | $4,844 | $405,945 | $203,257 | $202,688 |
| 2015 | $4,795 | $399,848 | $200,204 | $199,644 |
| 2014 | $4,660 | $392,017 | $196,283 | $195,734 |
Source: Public Records
Map
Nearby Homes
- 551 Chestnut Ave
- 591 Marylinn Dr
- 207 Redwood Ave
- 1200 N Abbott Ave Unit 200
- 1199 N Abbott Ave
- 603 Penitencia St
- 1120 California Cir
- 170 Marylinn Dr
- 102 Marylinn Dr
- 1279 Milkweed St
- 73 Images Cir
- 1363 Lilac Way
- 622 Chamise Way
- 1357 Lilac Way
- 1359 Lilac Way
- 1359 California Cir
- 7280 Marylinn Dr
- 1361 Lilac Way
- 1355 Lilac Way
- 0 Railroad Ave
Your Personal Tour Guide
Ask me questions while you tour the home.